

Question: For the following data draw the control chart for variables,. Analyze the following Control chart for X-S chart and give your interpretation Draw s- chart.
For the following data draw the control chart for variables,. Analyze the following Control chart for X-S chart and give your interpretation Draw s- chart. Is the process under control, if not revise_(Trial control Limits and revision 45) Draw X bar-chart. Is the process under control, if not revise (Trial control Limits and revision 45) Limits for future use as a conclusion 10 marks
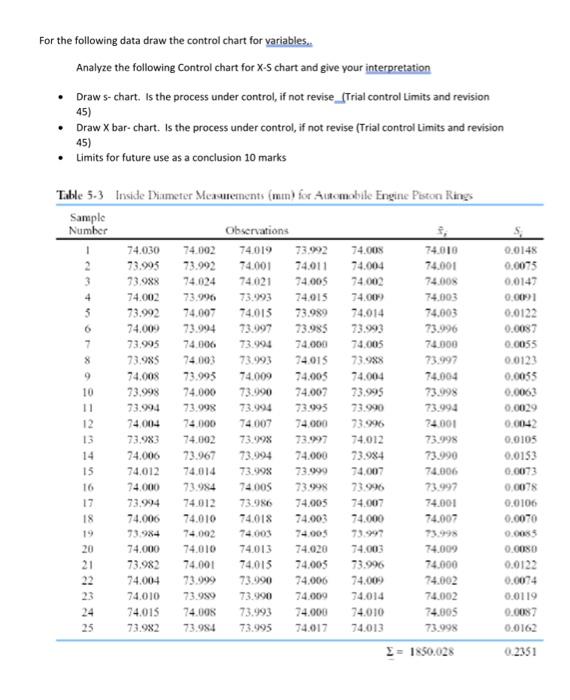
For the following data draw the control chart for variables. Analyze the following Control chart for X-S chart and give your interpretation - Draw s-chart. Is the process under control, if not revise__Trial control Limits and revision 45) - Draw X bar-chart. Is the process under control, if not revise (Trial control Limits and revision 45) - Limits for future use as a conclusion 10 marks Table 5.3 Inside Diameter Merurements (mm) for Astamoble Engine Poton Rings
Step by Step Solution
There are 3 Steps involved in it
1 Expert Approved Answer
Step: 1 Unlock

Question Has Been Solved by an Expert!
Get step-by-step solutions from verified subject matter experts
Step: 2 Unlock
Step: 3 Unlock