Question
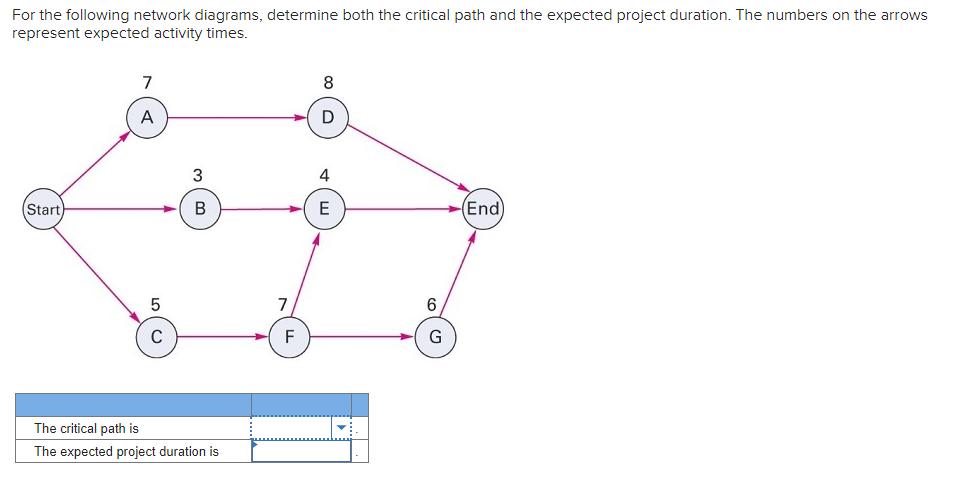
For the following network diagrams, determine both the critical path and the expected project duration. The numbers on the arrows represent expected activity times.

For the following network diagrams, determine both the critical path and the expected project duration. The numbers on the arrows represent expected activity times. (Start) 7 A 5 C 3 B The critical path is The expected project duration is 7 FL 8 D 4 E 6 () G (End)
Step by Step Solution
3.44 Rating (154 Votes )
There are 3 Steps involved in it
Step: 1
From the given data we have Show in table ...
Get Instant Access to Expert-Tailored Solutions
See step-by-step solutions with expert insights and AI powered tools for academic success
Step: 2

Step: 3

Ace Your Homework with AI
Get the answers you need in no time with our AI-driven, step-by-step assistance
Get StartedRecommended Textbook for
Operations Management
Authors: William J Stevenson
12th edition
2900078024107, 78024102, 978-0078024108
Students also viewed these General Management questions
Question
Answered: 1 week ago
Question
Answered: 1 week ago
Question
Answered: 1 week ago
Question
Answered: 1 week ago
Question
Answered: 1 week ago
Question
Answered: 1 week ago
Question
Answered: 1 week ago
Question
Answered: 1 week ago
Question
Answered: 1 week ago
Question
Answered: 1 week ago
Question
Answered: 1 week ago
Question
Answered: 1 week ago
Question
Answered: 1 week ago
Question
Answered: 1 week ago
Question
Answered: 1 week ago
Question
Answered: 1 week ago
Question
Answered: 1 week ago
Question
Answered: 1 week ago
Question
Answered: 1 week ago
View Answer in SolutionInn App


