

Question: For the following problems, use Exhibit A. For exhibit A, the amount of sales depends on the production volume shown below. Construct the Production volume
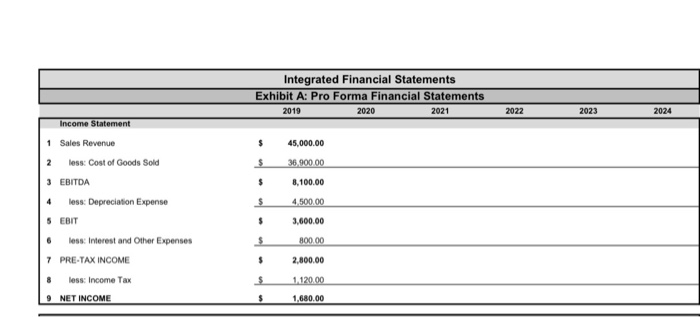
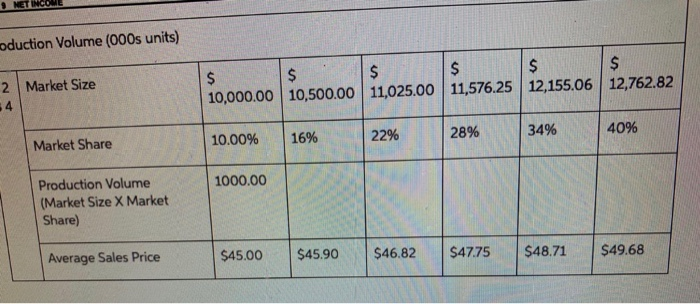
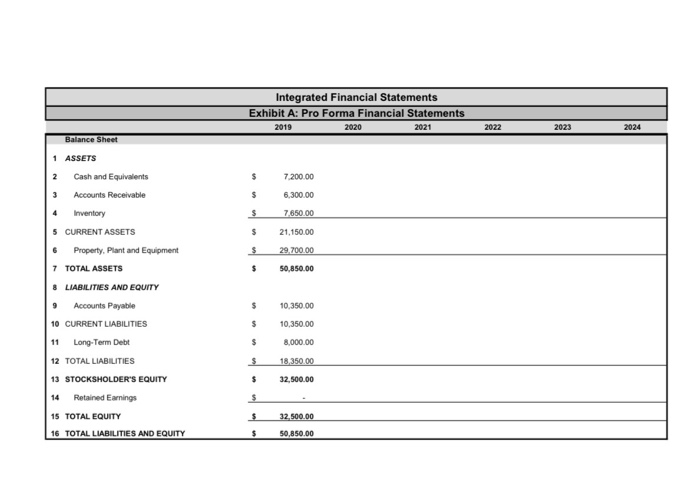
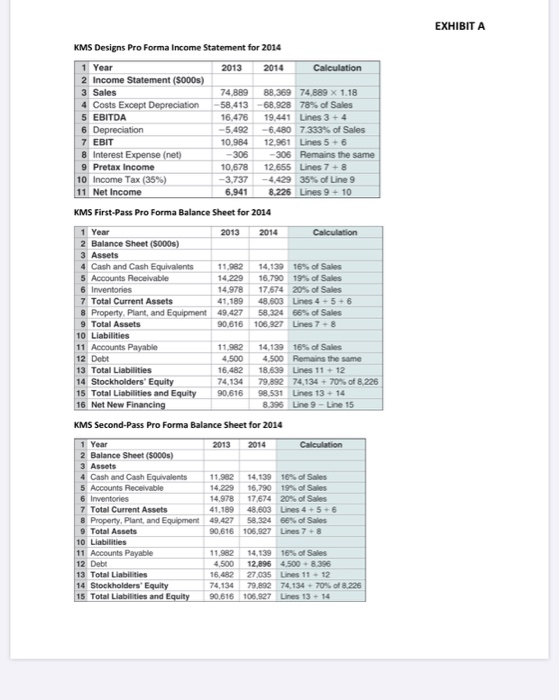
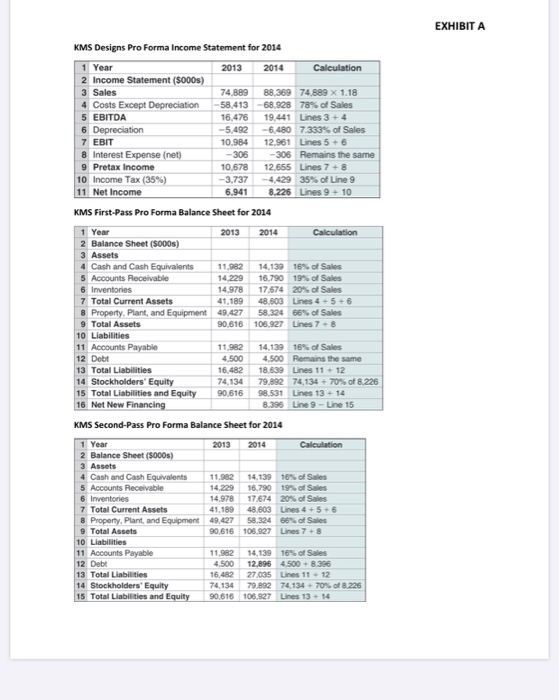
Integrated Financial Statements Exhibit A: Pro Forma Financial Statements 2019 2020 2021 2022 2023 2024 Income Statement 1 Sales Revenue 45,000.00 2 less: Cost of Goods Sold $ 36.900.00 8,100.00 3 EBITDA 4 less: Depreciation Expense 5 EBIT 4.500.00 3,600.00 6 less: Interest and Other Expenses 800.00 7 PRE-TAX INCOME 2,800.00 8 less: Income Tax 1.120.00 9 NET INCOME 1,680.00 oduction Volume (000s units) 2 Market Size 10,000.00 10,500.00 11,025.00 11,576.25 12,155.06 12,762.82 22% 34% 28% 40% 10.00% 16% Market Share 1000.00 Production Volume (Market Size X Market Share) Average Sales Price $45.00 $45.90 $46.82 $47.75 $48.71 $49.68 Integrated Financial Statements Exhibit A: Pro Forma Financial Statements 2019 2020 2021 2022 2023 2024 Balance Sheet 1 ASSETS Cash and Equivalents Accounts Receivable 3 4 7.200.00 6.300,00 7.650.00 Inventory CURRENT ASSETS Property. Plant and Equipment 21,150.00 29.700.00 50,850.00 7 TOTAL ASSETS 8 LIABILITIES AND EQUITY 9 Accounts Payable 10 CURRENT LIABILITIES 11 Long-Term Debt 12 TOTAL LIABILITIES 10,350.00 10,350,00 8,000.00 18.350.00 $ $ 32,500.00 13 STOCKSHOLDER'S EQUITY 14 Retained Earnings 15 TOTAL EQUITY 16 TOTAL LIABILITIES AND EQUITY $ $ 32,500.00 50,850.00 EXHIBIT A KMS Designs Pro Forma Income Statement for 2014 2013 2014 Calculation 1 Year 2 Income Statement (5000s) 3 Sales 4 Costs Except Depreciation 5 EBITDA 6 Depreciation 7 EBIT 8 Interest Expense (net) 9 Pretax Income 10 Income Tax (35%) 11 Net Income 74,889 88.369 74.889 X 1.18 -58,413 - 68.928 78% of Sales 16.476 19.441 Lines 3 + 4 -5,492 -6.480 7.333% of Sales 10.984 12.961 Lines 5 + 6 -306 -306 Remains the same 10.678 12.655 Lines 7 + 8 -3,737 -4,429 35% of Line 9 6.941 8.226 Lines 9 + 10 KMS First-Pass Pro Forma Balance Sheet for 2014 2013 2014 Calculation 1 Year 2 Balance Sheet (5000s) 3 Assets 4 Cash and Cash Equivalents 5 Accounts Receivable 6 Inventories 7 Total Current Assets 8 Property. Plant, and Equipment 9 Total Assets 10 Liabilities 11 Accounts Payable 12 Debt 13 Total Liabilities 14 Stockholders' Equity 15 Total Liabilities and Equity 16 Net New Financing 11.982 14 229 14.978 41.189 49.427 90 616 14,139 16% of Sales 16.790 19% of Sales 17 574 20% of Sales 48.603 Lines 4+5+6 58,324 66% of Sales 106.927 Unes 7 8 11.982 4.500 16.482 74,134 90,616 14,139 4.500 18.639 79 892 98.531 8.396 16% of Sales Remains the same Lines 11 + 12 74,134 + 70% of 8.226 Lines 13 + 14 Une 9 - Line 15 KMS Second-Pass Pro Forma Balance Sheet for 2014 2013 2014 Calculation 1 Year 2 Balance Sheet (5000s) 3 Assets 4 Cash and Cash Equivalents 5 Accounts Receivable 6 Inventories 7 Total Current Assets 8 Property, Plant, and Equipment 9 Total Assets 10 Liabilities 11 Accounts Payable 12 Debt 13 Total Liabilities 14 Stockholders' Equity 15 Total Liabilities and Equity 11.982 14 229 14.978 41,189 49,427 90,616 14,139 16.790 17,674 48.603 58.324 106,927 16 of Sales 19% of Sales 20% of Sales Lines 4 +5 +6 66% of Sales Lines 7 8 11.982 4.500 16.482 74.134 90,616 14,139 16% of Sales 12.895 4.500 +8.396 27035 Lines 11 + 12 79 892 74.134 70% of 8.226 105,927 Lines 13-14 EXHIBIT A KMS Designs Pro Forma Income Statement for 2014 2013 2014 Calculation 1 Year 2 Income Statement (5000s) 3 Sales 4 Costs Except Depreciation 5 EBITDA 6 Depreciation 7 EBIT 8 Interest Expense (net) 9 Pretax Income 10 Income Tax (35%) 11 Net Income 74,889 88.369 74.889 X 1.18 -58,413 - 68.928 78% of Sales 16.476 19.441 Lines 3 + 4 -5,492 -6.480 7.333% of Sales 10.984 12.961 Lines 5 + 6 -306 -306 Remains the same 10,678 12.655 Lines 7 + 8 -3,737 -4,429 35% of Line 9 6.941 8.226 Lines 9 + 10 KMS First-Pass Pro Forma Balance Sheet for 2014 2013 2014 Calculation 1 Year 2 Balance Sheet (5000s) 3 Assets 4 Cash and Cash Equivalents 5 Accounts Receivable 6 Inventories 7 Total Current Assets 8 Property. Plant, and Equipment 9 Total Assets 10 Liabilities 11 Accounts Payable 12 Debt 13 Total Liabilities 14 Stockholders' Equity 15 Total Liabilities and Equity 16 Net New Financing 11.982 14 229 14 978 41.189 49.427 90.616 14,139 16% of Sales 16.790 19% of Sales 17574 20% of Sales 48.603 Lines 4 +5 +6 58.324 66% of Sales 108.927 Lines 7-8 11.982 4.500 16.482 74,134 90,616 14,139 4 500 18.639 79 892 98 531 8.396 16% of Sales Romains the same Lines 11 + 12 74,134 + 70% of 8.226 Lines 13 + 14 Une 9-Line 15 KMS Second-Pass Pro Forma Balance Sheet for 2014 2013 2014 Calculation 1 Year 2 Balance Sheet (5000s) 3 Assets 4 Cash and Cash Equivalents 5 Accounts Receivable 6 Inventories 7 Total Current Assets 8 Property, Plant, and Equipment 9 Total Assets 10 Llabile 11 Accounts Payable 12 Debt 13 Total Liabilities 14 Stockholders' Equity 15 Total Liabilities and Equity 11.982 14 229 14.978 41,189 49,427 90,616 14,139 16.790 17,674 48.603 58.324 106,927 16 of Sales 19% of Sales 20% of Sales Lines 4+56 66% of Sales Lines 7 8 11.982 4.500 16.482 74.134 90,616 14,139 16% of Sales 12.895 4.500 +8.396 27035 Lines 11 + 12 79 902 74.13470% of 8 226 106,927 Lines 13-14
Step by Step Solution
There are 3 Steps involved in it

Get step-by-step solutions from verified subject matter experts