

Question: For the given data, if you need to draw the graph with the help of Microsoft Excel which trend line demonstrate the best R2 value?
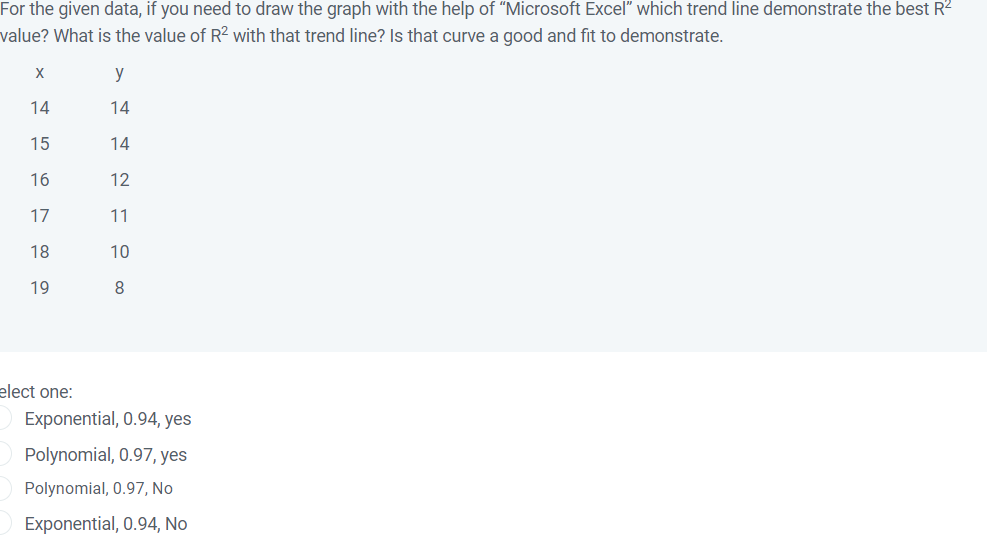
For the given data, if you need to draw the graph with the help of "Microsoft Excel" which trend line demonstrate the best R2 value? What is the value of R2 with that trend line? Is that curve a good and fit to demonstrate. X 14 14 15 14 16 12 17 11 18 10 19 8 elect one: Exponential, 0.94, yes Polynomial, 0.97, yes Polynomial, 0.97, No Exponential, 0.94, No
Step by Step Solution
There are 3 Steps involved in it
1 Expert Approved Answer
Step: 1 Unlock

Question Has Been Solved by an Expert!
Get step-by-step solutions from verified subject matter experts
Step: 2 Unlock
Step: 3 Unlock