

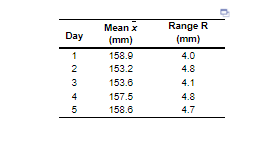
Question: For the given sample, Mean Factor (A 2 ) = Based on the sampling done, the control limit for 3-sigma x-chart are: Upper Control Limit
For the given sample, Mean Factor (A2 ) =
Based on the sampling done, the control limit for 3-sigma x-chart are:
Upper Control Limit (UCL):
Lower Control Limit (LCL):
Based on the x-chart, the process is OUT OF CONTROL or IN CONTROL (please pick one)
What are the UCL and LCL using 3-sigma?
For the given sample size, Upper Range:
For the given sample size, Lower Range:
The control limits for the 3-sigma R-chart are:
Upper Control Limit:
Lower Control Limit:
Based on the R-Chart, the process is OUT OF CONTROL or IN CONTROL (please pick one)
Step by Step Solution
There are 3 Steps involved in it
1 Expert Approved Answer
Step: 1 Unlock

Question Has Been Solved by an Expert!
Get step-by-step solutions from verified subject matter experts
Step: 2 Unlock
Step: 3 Unlock