

Question: For the graph: 1. Complete the following table and create a graph of mass of solid vs, volume of solid. TABLE 3.4 2. What is
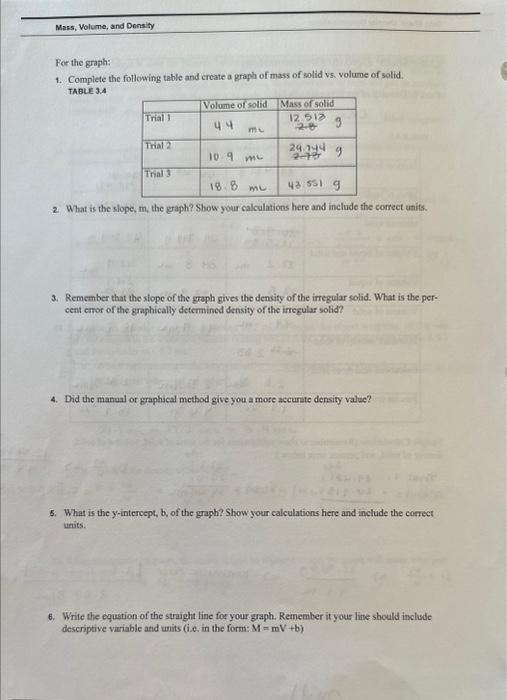
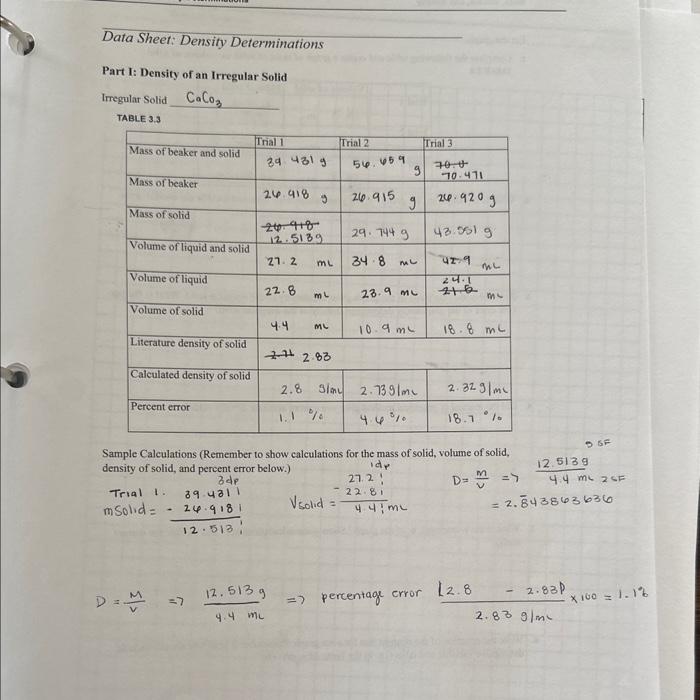
For the graph: 1. Complete the following table and create a graph of mass of solid vs, volume of solid. TABLE 3.4 2. What is the slope, m, the graph? Show your calculations here and include the correct units. 3. Remember that the slope of the greph gives the density of the irregular solid. What is the percent ernor of the graphically determined density of the irregular solid? 4. Did the manual of graphical method give you a more accurste density value? 5. What is the y-intercept, b, of the graph? Show your calculations here and include the correct units. 6. Write the equetion of the straight line for your graph. Remember it your line should include descriptive viriable and units (i.e. in the form: M=mV+b ) Data Sheet: Density Determinations Part I: Density of an Irregular Solid Irregular Solid CaCO3 TABLE 3.3 Sample Calculations (Remember to show calculations for the mass of solid, volume of solid, density of solid, and percent error below.) D=vM=74.4mL12.513g percentage crror 2.832.8
Step by Step Solution
There are 3 Steps involved in it

Get step-by-step solutions from verified subject matter experts