

Question: please please help cy and Errors Enter the mass of the clean dry 100-ml beaker (9) 67.57 Report Table MX.1: Mass and Volume Measurements Mass
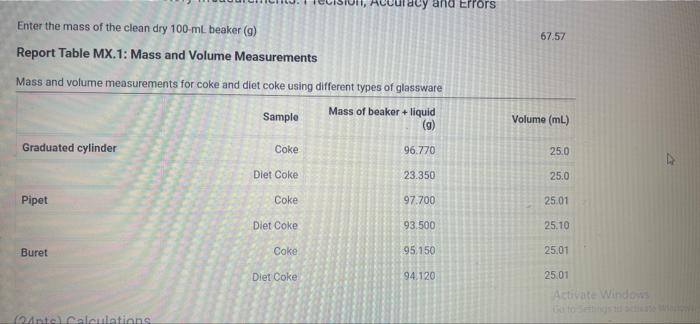
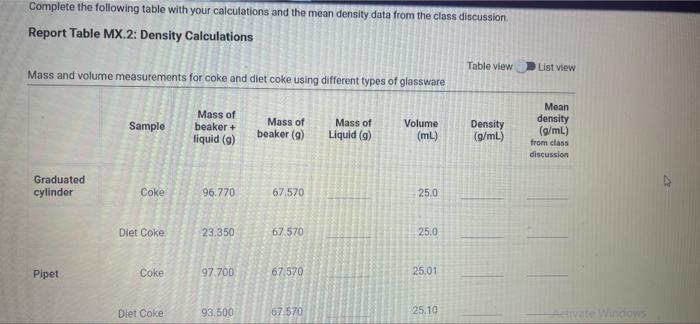
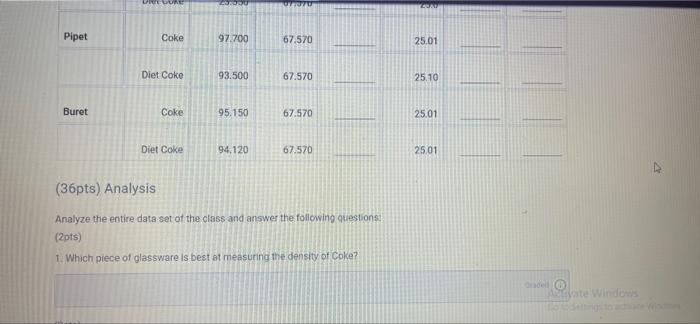
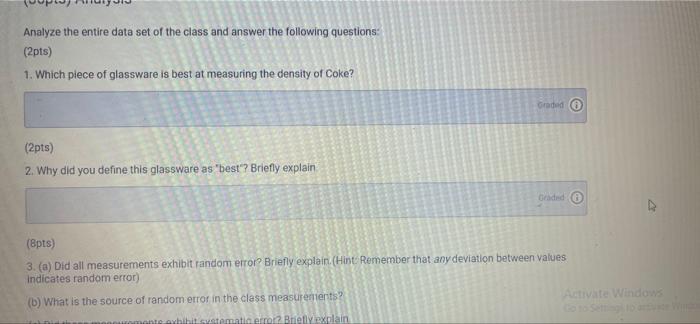
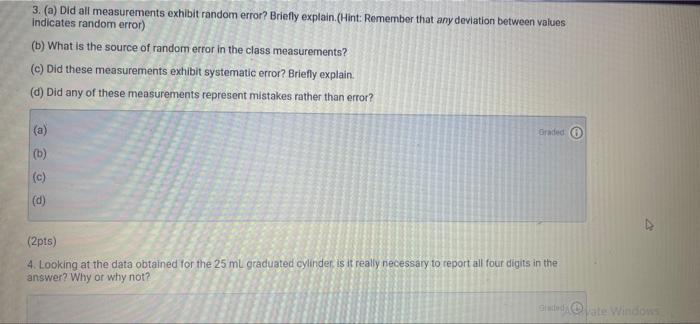
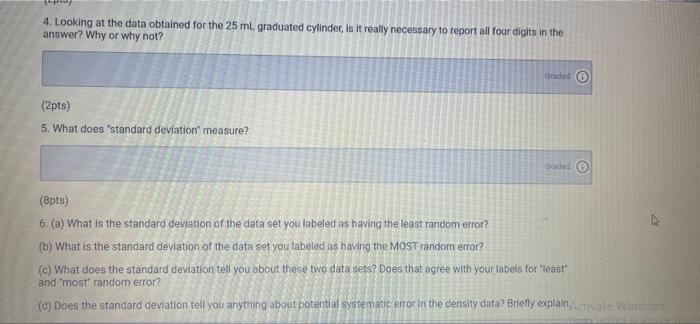
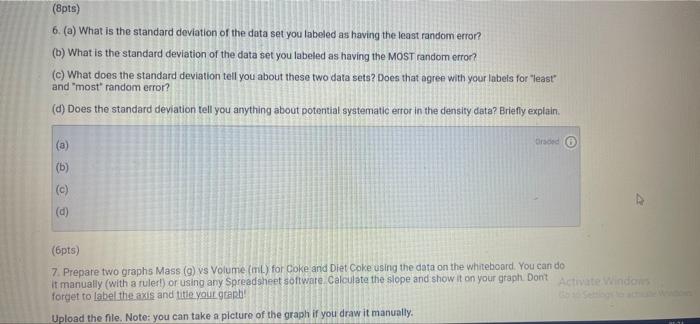
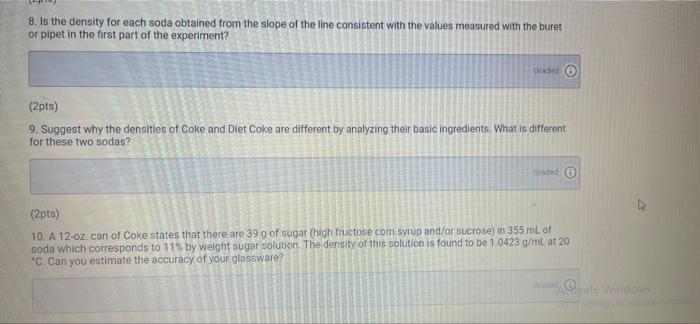
cy and Errors Enter the mass of the clean dry 100-ml beaker (9) 67.57 Report Table MX.1: Mass and Volume Measurements Mass and volume measurements for coke and diet coke using different types of glassware Mass of beaker + liquid Sample (9) Graduated cylinder Coke 96.770 Volume (mL) 25.0 Diet Coke 23.350 25.0 Pipet Coke 97.700 25.01 Diet Coke 93.500 25.10 Buret Coke 95.150 25.01 Diet Coke 94.120 25.01 Activate Windows to Ante alculations Complete the following table with your calculations and the mean density data from the class discussion. Report Table MX.2: Density Calculations Table view List View Mass and volume measurements for coke and diet coke using different types of glassware Sample Volume Mass of beaker + liquid (9) Mass of beaker (9) Mass of Liquid (9) (mL) Density (g/mL) Mean density (g/mL) from class discussion Graduated cylinder Coke 96.770 67.570 25.0 Diet Coke 23.350 67.570 25.0 Pipet Coke 97.700 67,570 25.01 Diet Coke 93,500 67 570 25.10 wate Windows LA LUUN LON Pipet Coke 97.700 67.570 25.01 Diet Coke 93.500 67.570 25.10 Buret Coke 95.150 67.570 25.01 Diet Coke 94,120 67.570 25.01 (36pts) Analysis Analyze the entire data set of the class and answer the following questions (2pts) 1. Which piece of glassware is best at measuring the density of Coke? lo te Windo Analyze the entire data set of the class and answer the following questions: (2pts) 1. Which piece of glassware is best at measuring the density of Coke? Credo (2pts) 2. Why did you define this glassware as "best"? Briefly explain Gaded (Bpts) 3. (a) Did all measurements exhibit random error? Briefly explain (Hint: Remember that any deviation between values Indicates random error) (b) What is the source of random error in the class measurements? Activate Windows to white erraz Bretly axrlain 3. (a) Did all measurements exhibit random error? Briefly explain.(Hint: Remember that any deviation between values Indicates random error) (b) What is the source of random error in the class measurements? (e) Did these measurements exhibit systematic error? Briefly explain (d) Did any of these measurements represent mistakes rather than error? Graded (a) (b) (c) (d) (2pts) 4. Looking at the data obtained for the 25 ml graduated cylinder is it really necessary to report all four digits in the answer? Why or why not? Gebed late Windows 4. Looking at the data obtained for the 25 ml graduated cylinder, is it really necessary to report all four digits in the answer? Why or why not? Gridad (2pts) 5. What does "standard deviation" measure? de (8pts) 6. (a) What is the standard deviation of the data set you labeled as having the least random error? (b) What is the standard deviation of the data set you labeled as having the MOST random error? (c) What does the standard deviation tell you about these two data sets? Does that agree with your labels for "least and "most random error? (d) Does the standard deviation tell you anything about potential systematic error in the density data? Briefly explainctivate Window (8pts) 6. (a) What is the standard deviation of the data set you labeled as having the least random error? (b) What is the standard deviation of the data set you labeled as having the MOST random error? (c) What does the standard deviation tell you about these two data sets? Does that agree with your labels for "least and most random error? (d) Does the standard deviation tell you anything about potential systematic error in the density data? Briefly explain. rodo (a) (b) (c) (d) (6pts) 7. Prepare two graphs Mass (9) vs Volume (ml) for Coke and Diet Coke using the data on the whiteboard. You can do it manually (with a ruler!) or using any Spreadsheet software Calculate the slope and show it on your graph Dont Activate Window forget to label the axis and title you gab! Upload the file. Note: you can take a picture of the graph if you draw it manually. 8. Is the density for each soda obtained from the slope of the line consistent with the values measured with the buret or pipet in the first part of the experiment? Grade (2pts) 9. Suggest why the densities of Coke and Diet Coke are different by analyzing their basic ingredients. What is different for these two sodas? (2pts) 10. A 12-ozcan of Coke states that there are 39 g of sugar (high fructose com syrup and/or sucrose) in 355 ml of soda which corresponds to 11% by weight sugar solution. The density of this solution is found to be 1.0423 g/mL at 20 *C. Can you estimate the accuracy of your glassware? doo
Step by Step Solution
There are 3 Steps involved in it

Get step-by-step solutions from verified subject matter experts