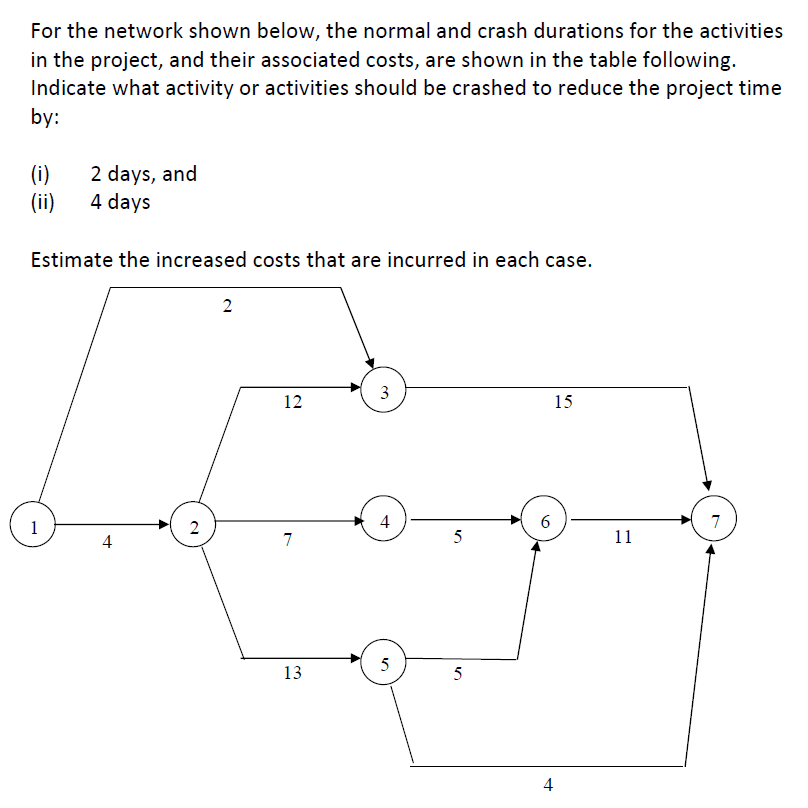
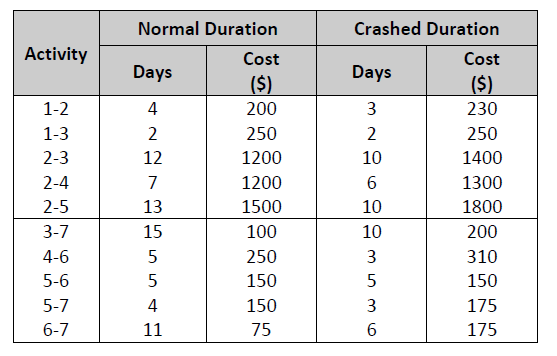
Question: For the network shown below, the normal and crash durations for the activities in the project, and their associated costs, are shown in the table

For the network shown below, the normal and crash

For the network shown below, the normal and crash

For the network shown below, the normal and crash durations for the activities in the project, and their associated costs, are shown in the table following. Indicate what activity or activities should be crashed to reduce the project time by: (i) (ii) 2 days, and 4 days Estimate the increased costs that are incurred in each case. 2 3 12 1 15 1 4 6 7 2 4 7 5 5 11 13 5 5 4 Activity 1-2 1-3 2-3 2-4 2-5 3-7 4-6 5-6 5-7 6-7 Normal Duration Cost Days ($) 4 200 2 250 12 1200 7 1200 13 1500 15 100 5 250 5 150 4. 150 11 75 Crashed Duration Cost Days ($) 3 230 2 250 10 1400 6 1300 10 1800 10 200 3 310 5 150 3 175 6 175

Step by Step Solution

There are 3 Steps involved in it

1 Expert Approved Answer
Step: 1 Unlock blur-text-image
Question Has Been Solved by an Expert!

Get step-by-step solutions from verified subject matter experts

Step: 2 Unlock
Step: 3 Unlock

Students Have Also Explored These Related General Management Questions!