

Question: for the second part I just need you to do D the graph is the corner right The figure is the graph of f; the
for the second part I just need you to do D the graph is the corner right
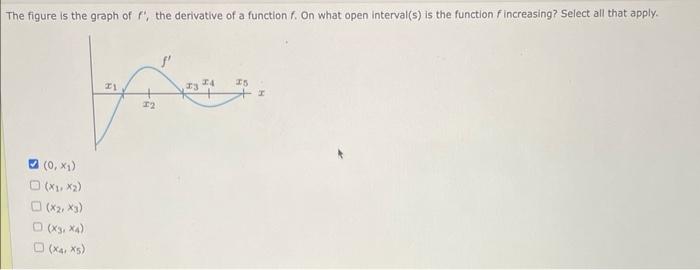
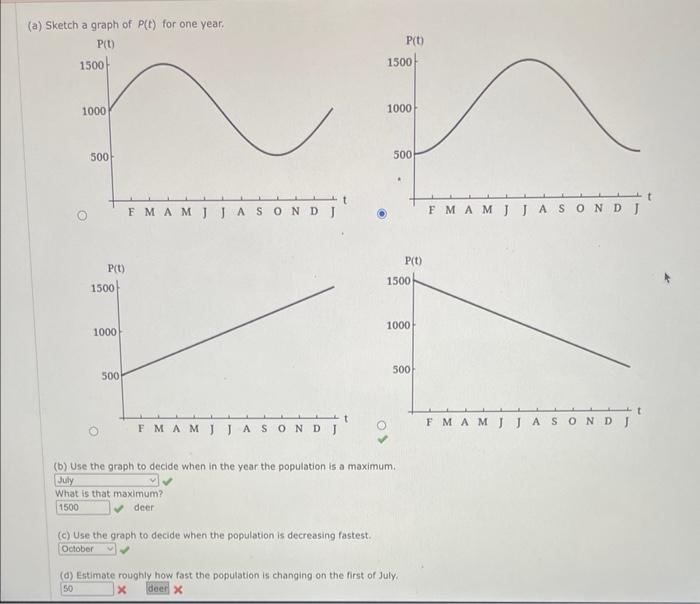
The figure is the graph of f; the derivative of a function f. On what open interval(s) is the function f increasing? Select all that apply. (0,x1)(x1,x2)(x2,x3)(x3,x4)(x4,x5) (a) Sketch a graph of P(t) for one year. (b) Use the graph to decide when in the year the population is a maximum. What is that maximum? 4 deer (c) Use the graph to decide when the population is decreasing fastest. (d) Eitimate roughly how fast the population is changing on the first of July
Step by Step Solution
There are 3 Steps involved in it
1 Expert Approved Answer
Step: 1 Unlock

Question Has Been Solved by an Expert!
Get step-by-step solutions from verified subject matter experts
Step: 2 Unlock
Step: 3 Unlock