

Question: **Plese show work/calculation** Check my work 12 From the data below for Apple (AAPL) stock, calculate the upper and lower Bollinger bands, which represent plus
**Plese show work/calculation**
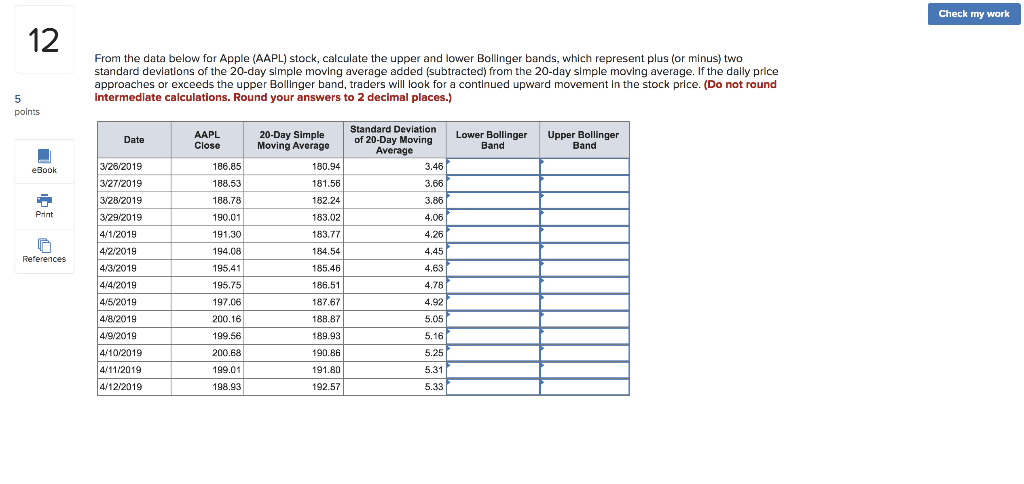
Check my work 12 From the data below for Apple (AAPL) stock, calculate the upper and lower Bollinger bands, which represent plus (or minus) two standard deviations of the 20-day simple moving average added (subtracted) from the 20-day simple moving average. If the daily price approaches or exceeds the upper Bollinger band, traders will look for a continued upward movement in the stock price. (Do not round Intermediate calculations. Round your answers to 2 decimal places.) Points 5 points Date AAPL Close 20-Day Simple Moving Average Standard Deviation of 20-Day Moving Average 3.46 Lower Bollinger Band Upper Bollinger Band eBook 180.94 181.56 3.66 182.24 3.86 3/26/2019 3/27/2019 3/28/2019 3/29/2019 4/1/2019 4/2/2019 Print 186.85 188.53 188.78 190.01 191.30 194.08 195,41 195.75 197.06 183.02 183.77 References 184.54 185.46 186.51 187.67 4.06 4.26 4.45 4.63 4.78 4.92 5.05 5.16 5.25 5.31 5.33 200.16 4/3/2019 4/4/2019 4/5/2019 4/8/2019 4/9/2019 4/10/2019 4/11/2019 4/12/2019 188.87 189.93 190.86 199.56 200.68 199.01 198.93 191.80 192.57
Step by Step Solution
There are 3 Steps involved in it

Get step-by-step solutions from verified subject matter experts