

Question: From the data shown in the table here, 6 , that contains historical monthly prices and dividends (paid at the end of the month) for
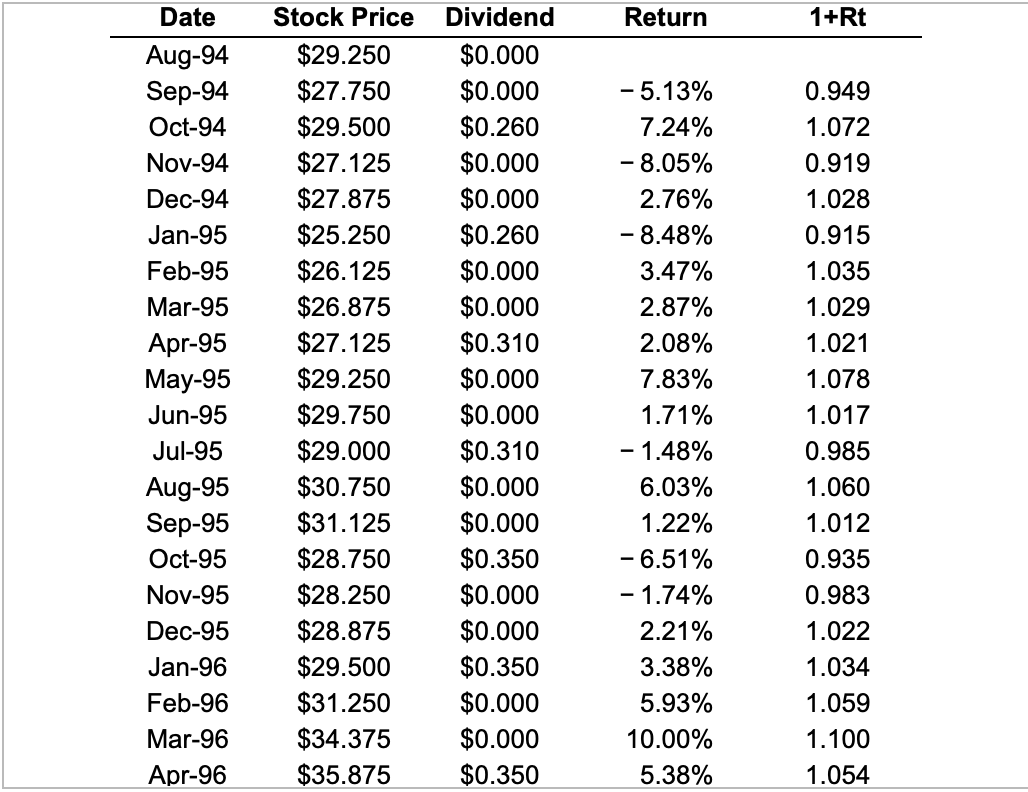
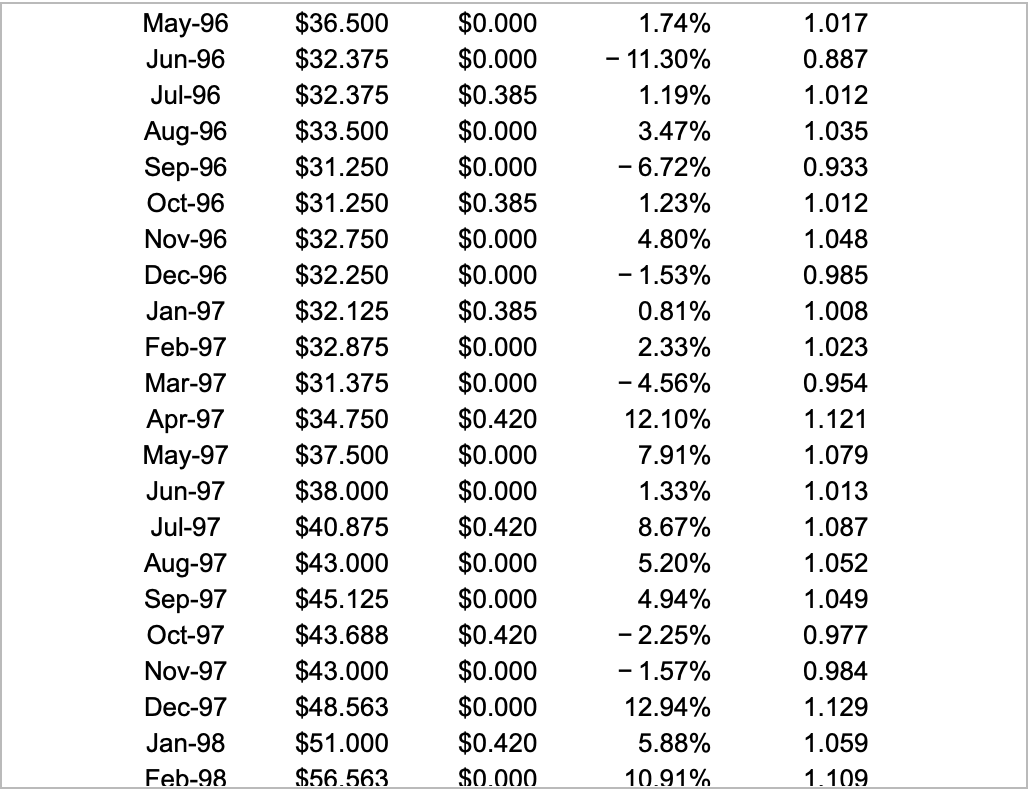
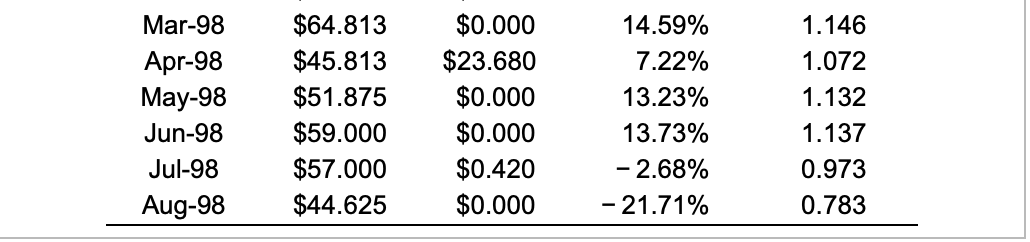
From the data shown in the table here, 6 , that contains historical monthly prices and dividends (paid at the end of the month) for Ford Motor Company stock (Ticker: F) from August 1994 to August 1998. Calculate the realized return over this period, expressing your answer in percent per month (i.e., what monthly return would have led to the same cumulative performance as an investment in Ford stock over this period). The total return is %. (Round to two decimal places.) The equivalent monthly return is %. (Round to two decimal places.) Return 1+Rt Date Aug-94 Sep-94 Oct-94 Nov-94 Dec-94 Jan-95 Feb-95 Mar-95 Apr-95 May-95 Jun-95 Jul-95 Aug-95 Sep-95 Oct-95 Nov-95 Dec-95 Jan-96 Feb-96 Mar-96 Apr-96 Stock Price $29.250 $27.750 $29.500 $27.125 $27.875 $25.250 $26.125 $26.875 $27.125 $29.250 $29.750 $29.000 $30.750 $31.125 $28.750 $28.250 $28.875 $29.500 $31.250 $34.375 $35.875 Dividend $0.000 $0.000 $0.260 $0.000 $0.000 $0.260 $0.000 $0.000 $0.310 $0.000 $0.000 $0.310 $0.000 $0.000 $0.350 $0.000 $0.000 $0.350 $0.000 $0.000 $0.350 - 5.13% 7.24% -8.05% 2.76% -8.48% 3.47% 2.87% 2.08% 7.83% 1.71% -1.48% 6.03% 1.22% - 6.51% - 1.74% 2.21% 3.38% 5.93% 10.00% 5.38% 0.949 1.072 0.919 1.028 0.915 1.035 1.029 1.021 1.078 1.017 0.985 1.060 1.012 0.935 0.983 1.022 1.034 1.059 1.100 1.054 May-96 Jun-96 Jul-96 Aug-96 Sep-96 Oct-96 Nov-96 Dec-96 Jan-97 Feb-97 Mar-97 Apr-97 May-97 Jun-97 Jul-97 Aug-97 Sep-97 Oct-97 Nov-97 Dec-97 Jan-98 Feb-98 $36.500 $32.375 $32.375 $33.500 $31.250 $31.250 $32.750 $32.250 $32.125 $32.875 $31.375 $34.750 $37.500 $38.000 $40.875 $43.000 $45.125 $43.688 $43.000 $48.563 $51.000 $56.563 $0.000 $0.000 $0.385 $0.000 $0.000 $0.385 $0.000 $0.000 $0.385 $0.000 $0.000 $0.420 $0.000 $0.000 $0.420 $0.000 $0.000 $0.420 $0.000 $0.000 $0.420 $0.000 1.74% - 11.30% 1.19% 3.47% -6.72% 1.23% 4.80% - 1.53% 0.81% 2.33% - 4.56% 12.10% 7.91% 1.33% 8.67% 5.20% 4.94% -2.25% - 1.57% 12.94% 5.88% 10.91% 1.017 0.887 1.012 1.035 0.933 1.012 1.048 0.985 1.008 1.023 0.954 1.121 1.079 1.013 1.087 1.052 1.049 0.977 0.984 1.129 1.059 1.109 Mar-98 Apr-98 May-98 Jun-98 Jul-98 Aug-98 $64.813 $45.813 $51.875 $59.000 $57.000 $44.625 $0.000 $23.680 $0.000 $0.000 $0.420 $0.000 14.59% 7.22% 13.23% 13.73% -2.68% -21.71% 1.146 1.072 1.132 1.137 0.973 0.783 From the data shown in the table here, 6 , that contains historical monthly prices and dividends (paid at the end of the month) for Ford Motor Company stock (Ticker: F) from August 1994 to August 1998. Calculate the realized return over this period, expressing your answer in percent per month (i.e., what monthly return would have led to the same cumulative performance as an investment in Ford stock over this period). The total return is %. (Round to two decimal places.) The equivalent monthly return is %. (Round to two decimal places.) Return 1+Rt Date Aug-94 Sep-94 Oct-94 Nov-94 Dec-94 Jan-95 Feb-95 Mar-95 Apr-95 May-95 Jun-95 Jul-95 Aug-95 Sep-95 Oct-95 Nov-95 Dec-95 Jan-96 Feb-96 Mar-96 Apr-96 Stock Price $29.250 $27.750 $29.500 $27.125 $27.875 $25.250 $26.125 $26.875 $27.125 $29.250 $29.750 $29.000 $30.750 $31.125 $28.750 $28.250 $28.875 $29.500 $31.250 $34.375 $35.875 Dividend $0.000 $0.000 $0.260 $0.000 $0.000 $0.260 $0.000 $0.000 $0.310 $0.000 $0.000 $0.310 $0.000 $0.000 $0.350 $0.000 $0.000 $0.350 $0.000 $0.000 $0.350 - 5.13% 7.24% -8.05% 2.76% -8.48% 3.47% 2.87% 2.08% 7.83% 1.71% -1.48% 6.03% 1.22% - 6.51% - 1.74% 2.21% 3.38% 5.93% 10.00% 5.38% 0.949 1.072 0.919 1.028 0.915 1.035 1.029 1.021 1.078 1.017 0.985 1.060 1.012 0.935 0.983 1.022 1.034 1.059 1.100 1.054 May-96 Jun-96 Jul-96 Aug-96 Sep-96 Oct-96 Nov-96 Dec-96 Jan-97 Feb-97 Mar-97 Apr-97 May-97 Jun-97 Jul-97 Aug-97 Sep-97 Oct-97 Nov-97 Dec-97 Jan-98 Feb-98 $36.500 $32.375 $32.375 $33.500 $31.250 $31.250 $32.750 $32.250 $32.125 $32.875 $31.375 $34.750 $37.500 $38.000 $40.875 $43.000 $45.125 $43.688 $43.000 $48.563 $51.000 $56.563 $0.000 $0.000 $0.385 $0.000 $0.000 $0.385 $0.000 $0.000 $0.385 $0.000 $0.000 $0.420 $0.000 $0.000 $0.420 $0.000 $0.000 $0.420 $0.000 $0.000 $0.420 $0.000 1.74% - 11.30% 1.19% 3.47% -6.72% 1.23% 4.80% - 1.53% 0.81% 2.33% - 4.56% 12.10% 7.91% 1.33% 8.67% 5.20% 4.94% -2.25% - 1.57% 12.94% 5.88% 10.91% 1.017 0.887 1.012 1.035 0.933 1.012 1.048 0.985 1.008 1.023 0.954 1.121 1.079 1.013 1.087 1.052 1.049 0.977 0.984 1.129 1.059 1.109 Mar-98 Apr-98 May-98 Jun-98 Jul-98 Aug-98 $64.813 $45.813 $51.875 $59.000 $57.000 $44.625 $0.000 $23.680 $0.000 $0.000 $0.420 $0.000 14.59% 7.22% 13.23% 13.73% -2.68% -21.71% 1.146 1.072 1.132 1.137 0.973 0.783
Step by Step Solution
There are 3 Steps involved in it

Get step-by-step solutions from verified subject matter experts