

Question: Using the data shown in the table here, E, that contains historical monthly prices and dividends (paid at the end of the month) for Ford
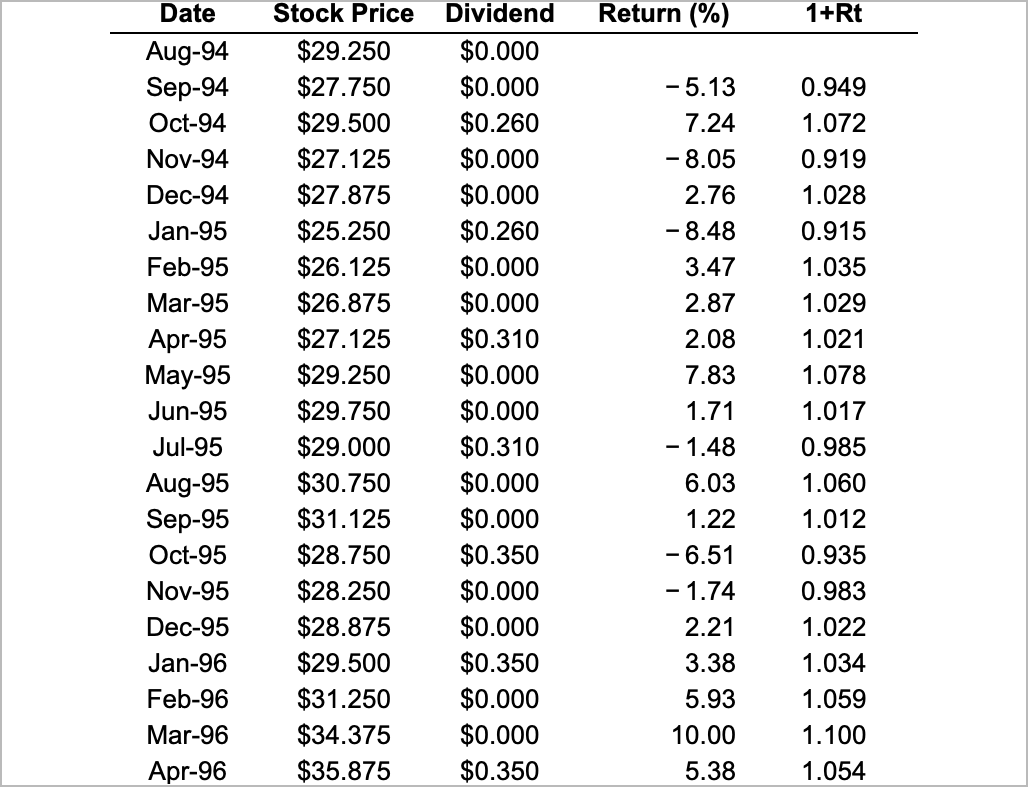
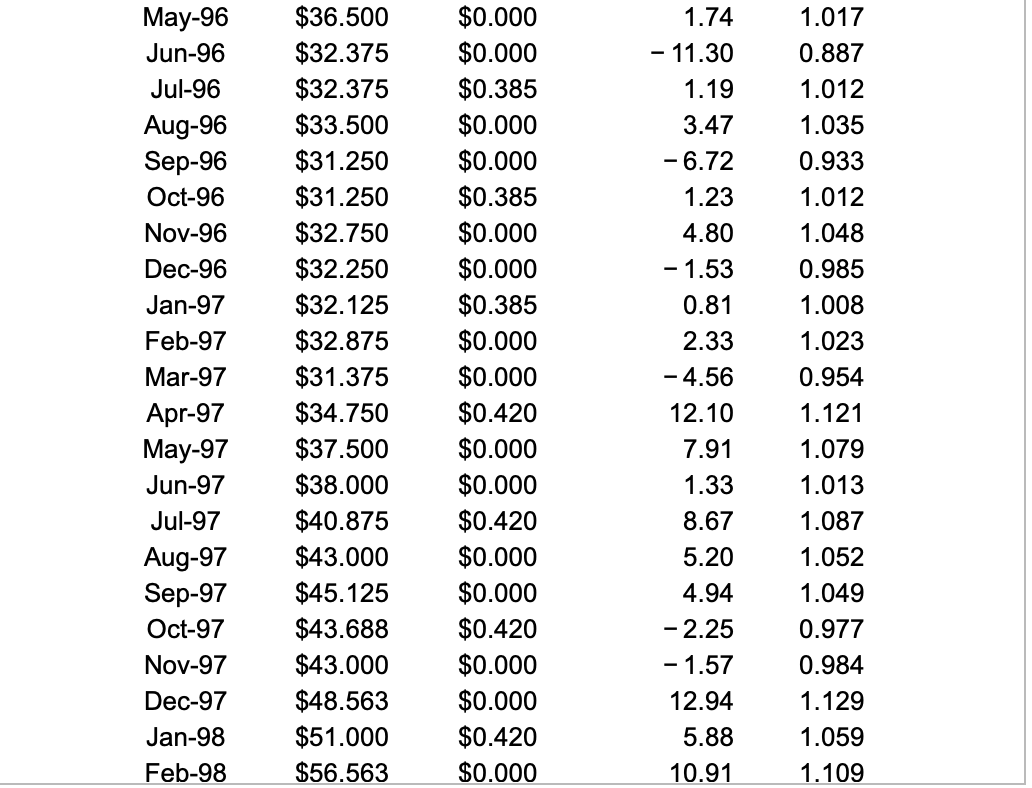
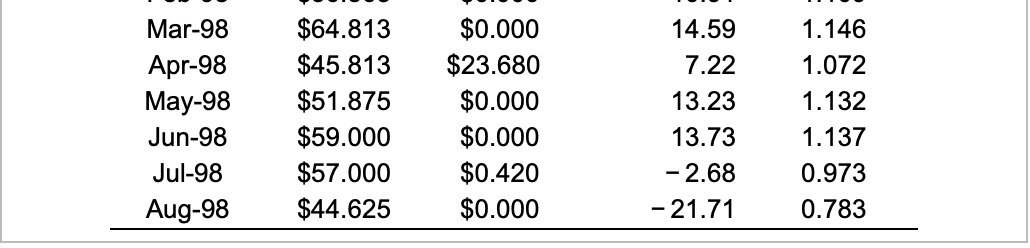
Using the data shown in the table here, E, that contains historical monthly prices and dividends (paid at the end of the month) for Ford Motor Company stock (Ticker: F) from August 1994 to August 1998, compute the: a. Average monthly return over this period. b. Monthly volatility (or standard deviation) over this period. c. 95% confidence interval of the estimate of the average monthly return. a. Average monthly return over this period. The average monthly return is %. (Round to two decimal places.) b. Monthly volatility (or standard deviation) over this period. The volatility of the monthly returns is %. (Round to two decimal places.) c. Compute the 95% confidence interval of the estimate of the average monthly return. The 95% confidence interval is % and %. (Round to two decimal places.) Date Return (%) 1+Rt Aug-94 Sep-94 Oct-94 Nov-94 Dec-94 Jan-95 Feb-95 Mar-95 Apr-95 May-95 Jun-95 Jul-95 Aug-95 Sep-95 Oct-95 Nov-95 Dec-95 Jan-96 Feb-96 Mar-96 Apr-96 Stock Price $29.250 $27.750 $29.500 $27.125 $27.875 $25.250 $26.125 $26.875 $27.125 $29.250 $29.750 $29.000 $30.750 $31.125 $28.750 $28.250 $28.875 $29.500 $31.250 $34.375 $35.875 Dividend $0.000 $0.000 $0.260 $0.000 $0.000 $0.260 $0.000 $0.000 $0.310 $0.000 $0.000 $0.310 $0.000 $0.000 $0.350 $0.000 $0.000 $0.350 $0.000 $0.000 $0.350 -5.13 7.24 -8.05 2.76 -8.48 3.47 2.87 2.08 7.83 1.71 -1.48 6.03 1.22 -6.51 - 1.74 2.21 3.38 5.93 10.00 5.38 0.949 1.072 0.919 1.028 0.915 1.035 1.029 1.021 1.078 1.017 0.985 1.060 1.012 0.935 0.983 1.022 1.034 1.059 1.100 1.054 May-96 Jun-96 Jul-96 Aug-96 Sep-96 Oct-96 Nov-96 Dec-96 Jan-97 Feb-97 Mar-97 Apr-97 May-97 Jun-97 Jul-97 Aug-97 Sep-97 Oct-97 Nov-97 Dec-97 Jan-98 Feb-98 $36.500 $32.375 $32.375 $33.500 $31.250 $31.250 $32.750 $32.250 $32.125 $32.875 $31.375 $34.750 $37.500 $38.000 $40.875 $43.000 $45.125 $43.688 $43.000 $48.563 $51.000 $56.563 $0.000 $0.000 $0.385 $0.000 $0.000 $0.385 $0.000 $0.000 $0.385 $0.000 $0.000 $0.420 $0.000 $0.000 $0.420 $0.000 $0.000 $0.420 $0.000 $0.000 $0.420 $0.000 1.74 - 11.30 1.19 3.47 -6.72 1.23 4.80 - 1.53 0.81 2.33 - 4.56 12.10 7.91 1.33 8.67 5.20 4.94 -2.25 - 1.57 12.94 5.88 10.91 1.017 0.887 1.012 1.035 0.933 1.012 1.048 0.985 1.008 1.023 0.954 1.121 1.079 1.013 1.087 1.052 1.049 0.977 0.984 1.129 1.059 1.109 Mar-98 Apr-98 May-98 Jun-98 Jul-98 Aug-98 $64.813 $45.813 $51.875 $59.000 $57.000 $44.625 $0.000 $23.680 $0.000 $0.000 $0.420 $0.000 14.59 7.22 13.23 13.73 -2.68 -21.71 1.146 1.072 1.132 1.137 0.973 0.783 Using the data shown in the table here, E, that contains historical monthly prices and dividends (paid at the end of the month) for Ford Motor Company stock (Ticker: F) from August 1994 to August 1998, compute the: a. Average monthly return over this period. b. Monthly volatility (or standard deviation) over this period. c. 95% confidence interval of the estimate of the average monthly return. a. Average monthly return over this period. The average monthly return is %. (Round to two decimal places.) b. Monthly volatility (or standard deviation) over this period. The volatility of the monthly returns is %. (Round to two decimal places.) c. Compute the 95% confidence interval of the estimate of the average monthly return. The 95% confidence interval is % and %. (Round to two decimal places.) Date Return (%) 1+Rt Aug-94 Sep-94 Oct-94 Nov-94 Dec-94 Jan-95 Feb-95 Mar-95 Apr-95 May-95 Jun-95 Jul-95 Aug-95 Sep-95 Oct-95 Nov-95 Dec-95 Jan-96 Feb-96 Mar-96 Apr-96 Stock Price $29.250 $27.750 $29.500 $27.125 $27.875 $25.250 $26.125 $26.875 $27.125 $29.250 $29.750 $29.000 $30.750 $31.125 $28.750 $28.250 $28.875 $29.500 $31.250 $34.375 $35.875 Dividend $0.000 $0.000 $0.260 $0.000 $0.000 $0.260 $0.000 $0.000 $0.310 $0.000 $0.000 $0.310 $0.000 $0.000 $0.350 $0.000 $0.000 $0.350 $0.000 $0.000 $0.350 -5.13 7.24 -8.05 2.76 -8.48 3.47 2.87 2.08 7.83 1.71 -1.48 6.03 1.22 -6.51 - 1.74 2.21 3.38 5.93 10.00 5.38 0.949 1.072 0.919 1.028 0.915 1.035 1.029 1.021 1.078 1.017 0.985 1.060 1.012 0.935 0.983 1.022 1.034 1.059 1.100 1.054 May-96 Jun-96 Jul-96 Aug-96 Sep-96 Oct-96 Nov-96 Dec-96 Jan-97 Feb-97 Mar-97 Apr-97 May-97 Jun-97 Jul-97 Aug-97 Sep-97 Oct-97 Nov-97 Dec-97 Jan-98 Feb-98 $36.500 $32.375 $32.375 $33.500 $31.250 $31.250 $32.750 $32.250 $32.125 $32.875 $31.375 $34.750 $37.500 $38.000 $40.875 $43.000 $45.125 $43.688 $43.000 $48.563 $51.000 $56.563 $0.000 $0.000 $0.385 $0.000 $0.000 $0.385 $0.000 $0.000 $0.385 $0.000 $0.000 $0.420 $0.000 $0.000 $0.420 $0.000 $0.000 $0.420 $0.000 $0.000 $0.420 $0.000 1.74 - 11.30 1.19 3.47 -6.72 1.23 4.80 - 1.53 0.81 2.33 - 4.56 12.10 7.91 1.33 8.67 5.20 4.94 -2.25 - 1.57 12.94 5.88 10.91 1.017 0.887 1.012 1.035 0.933 1.012 1.048 0.985 1.008 1.023 0.954 1.121 1.079 1.013 1.087 1.052 1.049 0.977 0.984 1.129 1.059 1.109 Mar-98 Apr-98 May-98 Jun-98 Jul-98 Aug-98 $64.813 $45.813 $51.875 $59.000 $57.000 $44.625 $0.000 $23.680 $0.000 $0.000 $0.420 $0.000 14.59 7.22 13.23 13.73 -2.68 -21.71 1.146 1.072 1.132 1.137 0.973 0.783
Step by Step Solution
There are 3 Steps involved in it

Get step-by-step solutions from verified subject matter experts