

Question: From the data shown in the table here. Im that contains historical monthly prices and dividends (paid at the end of the month) for Ford
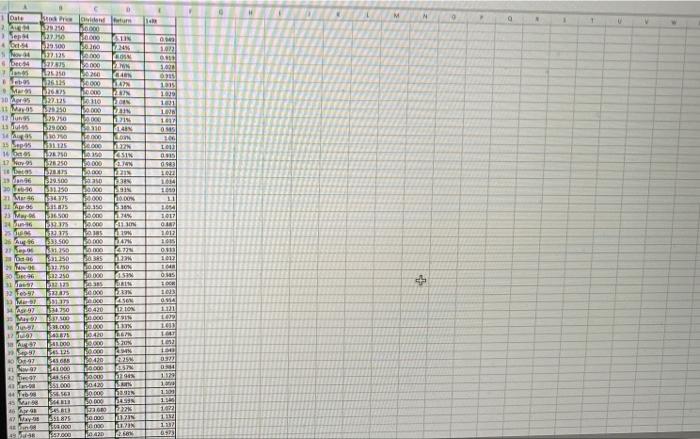
From the data shown in the table here. Im that contains historical monthly prices and dividends (paid at the end of the month) for Ford Motor Company stock (Ticker) from August 1984 to August 1996. Calculato the realized return over this period, expressing your answer in percent per month (e. what monthly return would have led to the same cumulative performance an an investment in Ford stock over this period). The total retum % (Round to two decimal places.) The equivalent monthly return in % (Round to two decimal places.) M M 0 1 Date 2 pm 4 ST De 129110 22 29.500 22:25 John 000 1.000 1020 NEL 1012 SITE OSE DO 3200 2020 AN 000 EN 1015 1030 10 SELE NE 26113 M 63 10 AS 10250 12 Tues 111 0.23 000 OLECU 00000 WAT ACE 14.000 110 LAN 219 ONS Seh ON Sep 16 12:01 OD 150 NEVI N12 LO SED OS OSZWE SCRUESI 00003 LON 0983 SER 0.000 NE TOT 13 2010 26 ONE 00000 35 104 1010 MEES 10.00 OLIS STEST SCHT DOSSI 150 000 10 WESI 23 May 30 3294 1017 24 141 019 047 ME CHO SZERET $93.500 150.000 1.000 1011 2015 OD OSTE SH 90 HONEY 1013 16 HO DOO 022710 12250 177 CON 159 DREN 30 00010 FES C C SCELE EDOR 103 327 00009 NEE NOSI VO TO 10430 121 MAS 97 Way ION IN 000 01 1750 STO 1.000 48 000 101 (RL 12 ) 12 97 SEXO 10.40 159.000 ON 15 NES 12000 LO WO 42 0 10:40 10000 Wor R0420 0000 100 127 14 . SEO TES TON 1 150 ner 1122 1 1.100 13 1022 11 ON 30.000 BAS 19 NESTO QUEEN NE NELIU S8155 000 DOO MO 430 DIZIN ZEIT 2.000 WERE 573
Step by Step Solution
There are 3 Steps involved in it

Get step-by-step solutions from verified subject matter experts