

Question: From the following data, apply Value Stream Mapping. Draw a current state map, identify waste, and propose changes for improvement. Table 1: VSM Data (Current
From the following data, apply Value Stream Mapping. Draw a current state map, identify waste, and propose changes for improvement.
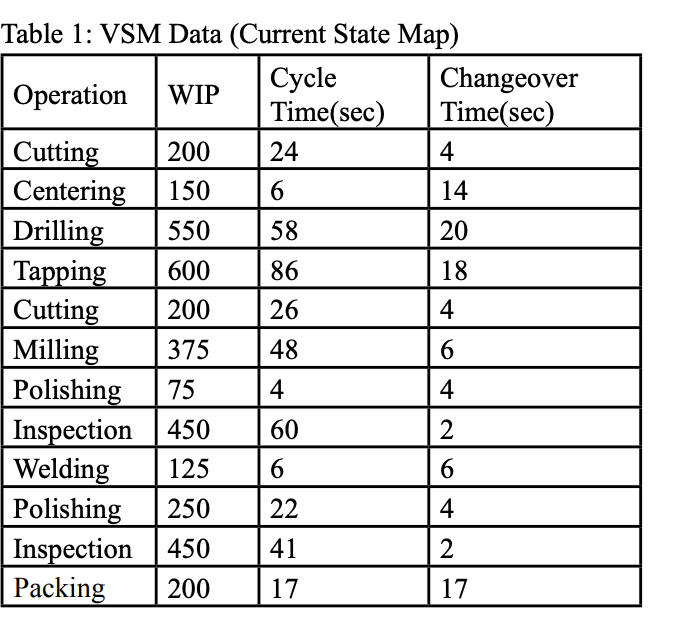
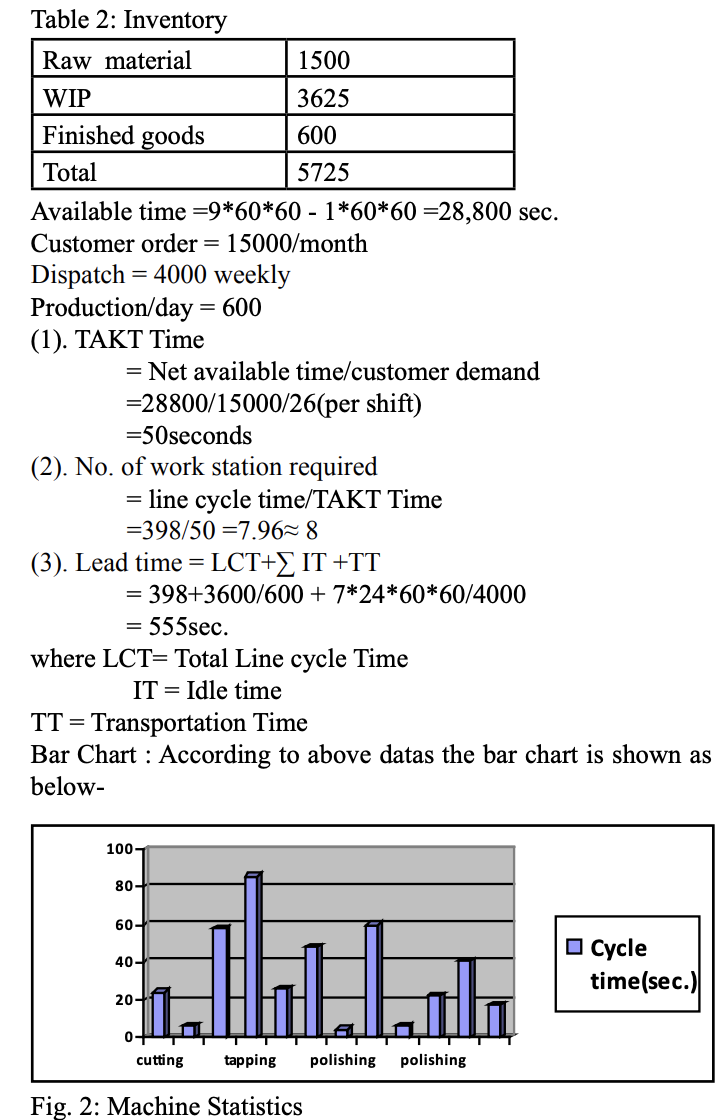
Table 1: VSM Data (Current State Map) \begin{tabular}{|l|l|l|l|} \hline Operation & WIP & CycleTime(sec) & ChangeoverTime(sec) \\ \hline Cutting & 200 & 24 & 4 \\ \hline Centering & 150 & 6 & 14 \\ \hline Drilling & 550 & 58 & 20 \\ \hline Tapping & 600 & 86 & 18 \\ \hline Cutting & 200 & 26 & 4 \\ \hline Milling & 375 & 48 & 6 \\ \hline Polishing & 75 & 4 & 4 \\ \hline Inspection & 450 & 60 & 2 \\ \hline Welding & 125 & 6 & 6 \\ \hline Polishing & 250 & 22 & 4 \\ \hline Inspection & 450 & 41 & 2 \\ \hline Packing & 200 & 17 & 17 \\ \hline \end{tabular} Table 2: Inventory Available time =9606016060=28,800sec. Customer order =15000/ month Dispatch =4000 weekly Production/day =600 (1). TAKT Time = Net available time/customer demand =28800/15000/26 (per shift) =50 seconds (2). No. of work station required = line cycle time/TAKT Time =398/50=7.968 (3). Lead time =LCT+IT+TT =398+3600/600+7246060/4000=555sec. where LCT = Total Line cycle Time IT = Idle time TT = Transportation Time Bar Chart : According to above datas the bar chart is sh below- Fig. 2: Machine Statistics
Step by Step Solution
There are 3 Steps involved in it

Get step-by-step solutions from verified subject matter experts