Question: Given below is the excel chart from the chart calculate the Cost Variance, Schedule Variance, Schedule Performance Index, Cost Performance Index, Estimate to Complete and

Given below is the excel chart from the chart calculate the Cost Variance, Schedule Variance, Schedule Performance Index, Cost Performance Index, Estimate to Complete and Estimate at Completion. Given below is the excel chart from the chart

300 A B C D E F 1 Cost Estimate % complete AC as of 2/28 PV as of 2/28 EV as of 2/28 2 Create wireframe $ 600 100% $ 700 $ 650 650.00 3 Create login/security $ 900 100% $ 550 $ 800 880.00 4. Create home page $ 400 0% $ 5 create image update page $ 1,200 75% $ 800 $ 1,100 1,100.00 6 create browsing page $ 800 50% $ 500 $ 450 500.00 7 integrate shopping cart $ 600 0% $ 8 create new customer page $ 500 100% $ 550 500 500.00 9 Create update customer page $ 0% $ 10 Create checkout page $ 600 0% $ 11 Integrate with bank processor $ 600 0% $ 12 UAT $ 1,200 40% $ 500 $ 350 500.00 13 TOTAL $ 7,700 $ 3,600 $ 3,850 4,130 14 15 CV 16 SV 17 SPI 18 CPI 19 ETC 20 EAC 21 $

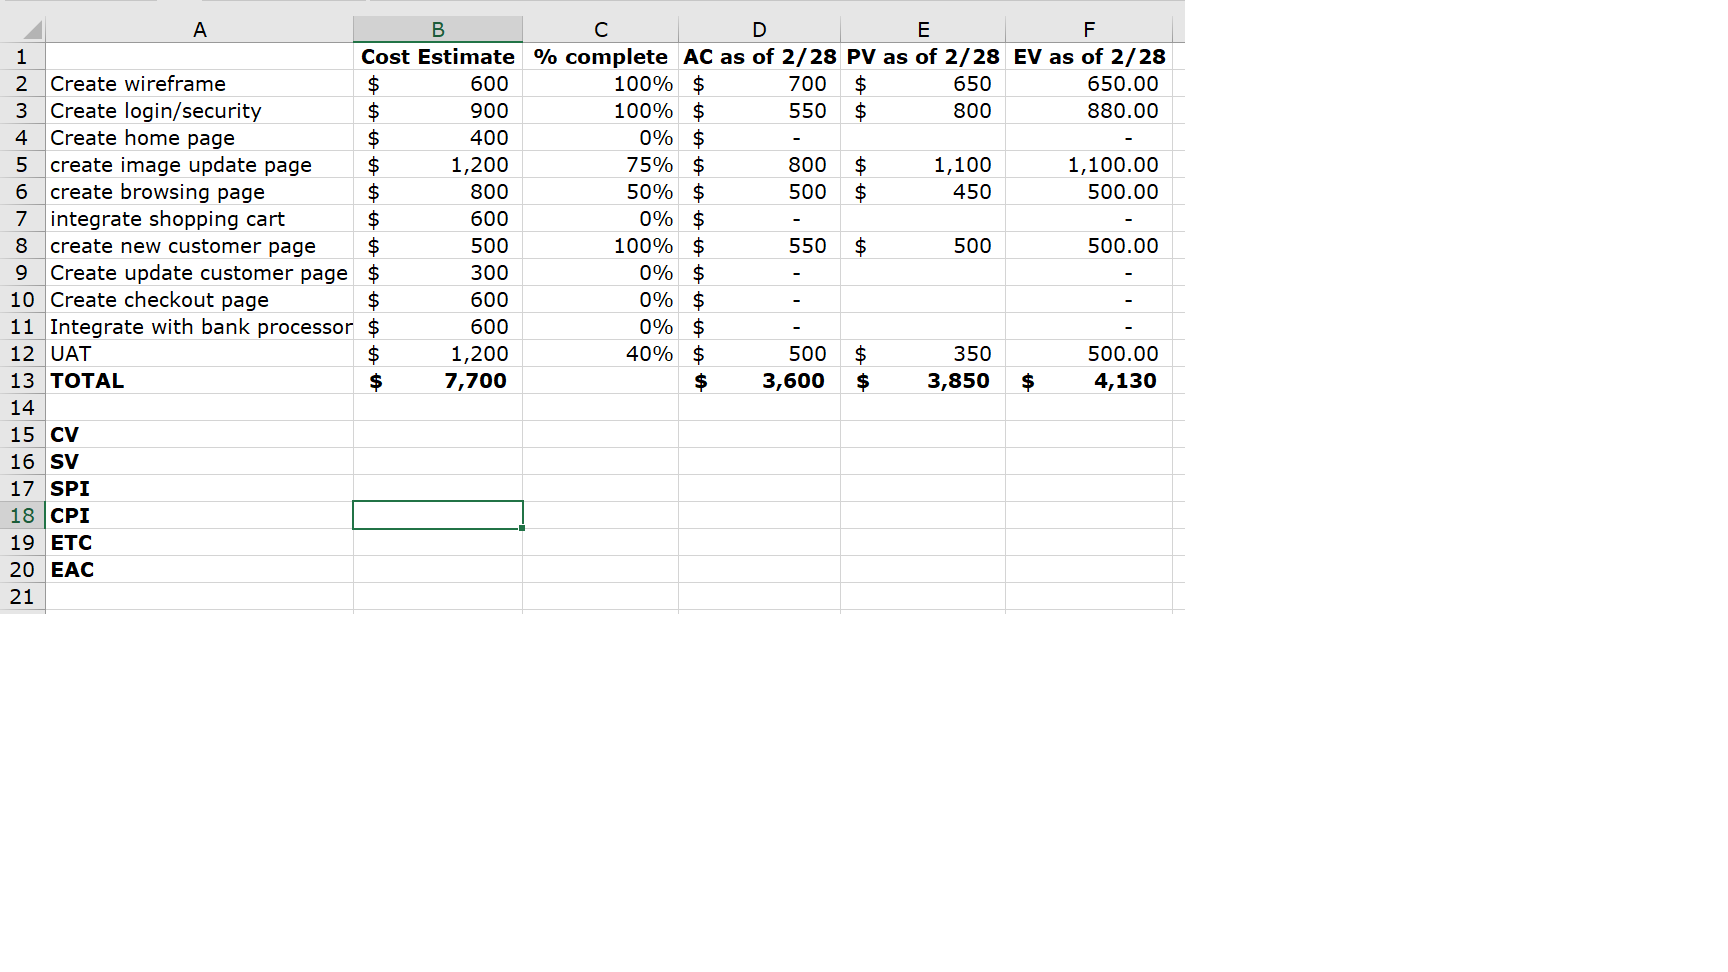
Step by Step Solution

There are 3 Steps involved in it

1 Expert Approved Answer
Step: 1 Unlock blur-text-image
Question Has Been Solved by an Expert!

Get step-by-step solutions from verified subject matter experts

Step: 2 Unlock
Step: 3 Unlock

Students Have Also Explored These Related General Management Questions!