

Question: Given the Activity on Arrow Diagram and the data found in the table above, calculate each of the following values: Given the Activity on Arrow
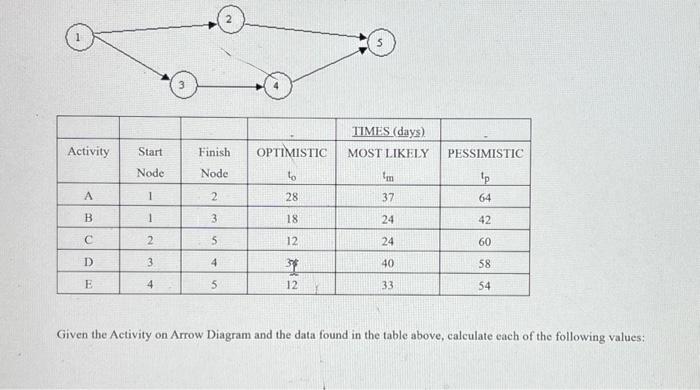

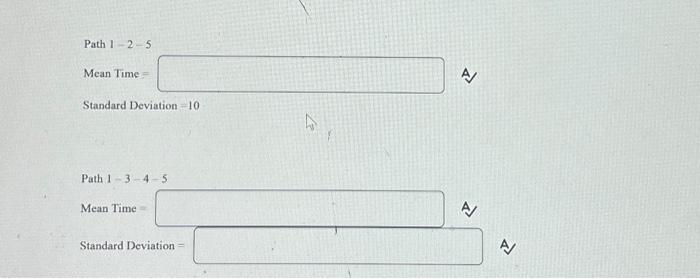
Given the Activity on Arrow Diagram and the data found in the table above, calculate each of the following values: Given the Activity on Arrow Diagram and the data found in the table above, calculate each of the following values: Activity A........ te=40 Standard Deviation =6 Activity B........ te= A Standard Deviation = A Activity C........ te= Standard Deviation = A Activity D....... te= A Standard Deviation = A Activity E......... A Standard Deviation =7 Path 125 Path 125 Mean Time : Standard Deviation =10 Path 1345 Mean Time = ( Standard Deviation =
Step by Step Solution
There are 3 Steps involved in it
1 Expert Approved Answer
Step: 1 Unlock

Question Has Been Solved by an Expert!
Get step-by-step solutions from verified subject matter experts
Step: 2 Unlock
Step: 3 Unlock