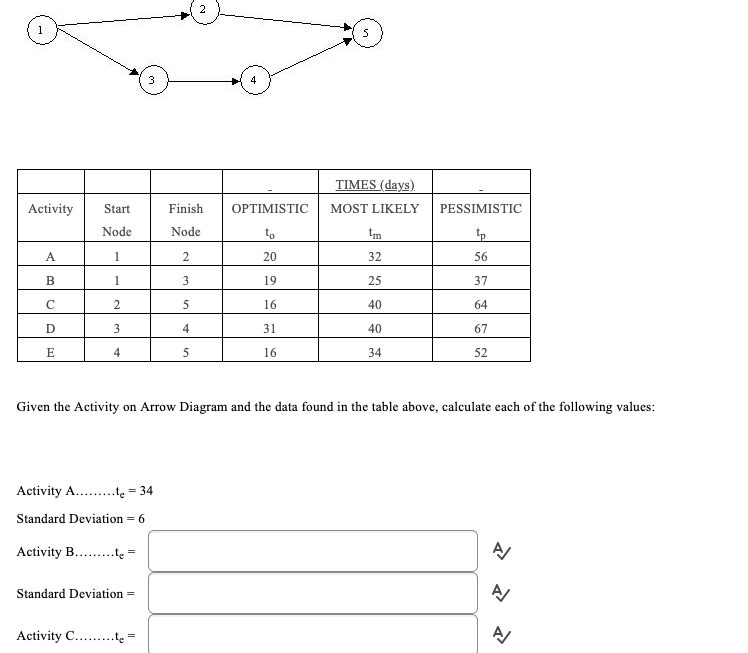
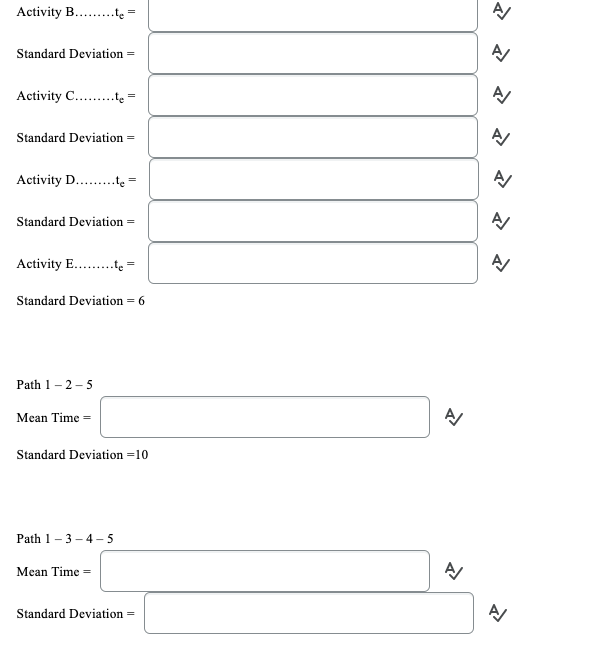
Question: TIMES (days) MOST LIKELY Activity OPTIMISTIC PESSIMISTIC Start Node Finish Node 16 Given the Activity on Arrow Diagram and the data found in the table

TIMES (days) MOST LIKELY Activity OPTIMISTICTIMES (days) MOST LIKELY Activity OPTIMISTIC

TIMES (days) MOST LIKELY Activity OPTIMISTIC PESSIMISTIC Start Node Finish Node 16 Given the Activity on Arrow Diagram and the data found in the table above, calculate each of the following values: Activity A.........te = 34 Standard Deviation = 6 Activity B.........te = Standard Deviation = Activity C.........te = Activity B.........te = Standard Deviation = Activity C........te = Standard Deviation = Activity D.........te = Standard Deviation = Activity E.........te = Standard Deviation = 6 Path 1-2-5 Mean Time = Standard Deviation =10 Path 1-3-4-5 Mean Time = Standard Deviation =

Step by Step Solution

There are 3 Steps involved in it

1 Expert Approved Answer
Step: 1 Unlock blur-text-image
Question Has Been Solved by an Expert!

Get step-by-step solutions from verified subject matter experts

Step: 2 Unlock
Step: 3 Unlock

Students Have Also Explored These Related General Management Questions!