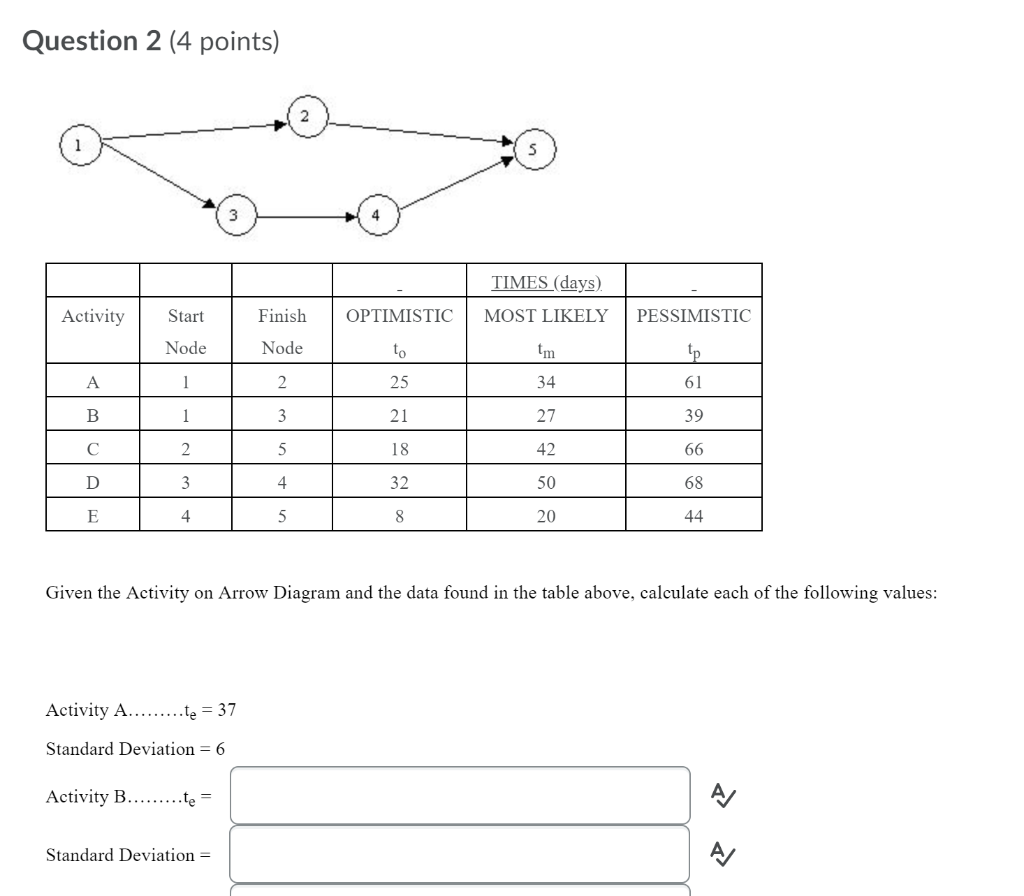
Question: Question 2 (4 points) TIMES (days) MOST LIKELY Activity OPTIMISTIC PESSIMISTIC Start Node Finish Node A 1 21 2 3. 5 18. - 5 44

Question 2 (4 points) TIMES (days) MOST LIKELYQuestion 2 (4 points) TIMES (days) MOST LIKELYQuestion 2 (4 points) TIMES (days) MOST LIKELY

Question 2 (4 points) TIMES (days) MOST LIKELY Activity OPTIMISTIC PESSIMISTIC Start Node Finish Node A 1 21 2 3. 5 18. - 5 44 Given the Activity on Arrow Diagram and the data found in the table above, calculate each of the following values: Activity A.........te = 37 Standard Deviation = 6 Activity B.........te = Standard Deviation = Activity A.........te = 37 Standard Deviation = 6 Activity B.........te = Standard Deviation = Activity C.........te Standard Deviation = Activity D.........te = Standard Deviation = Activity E.........te = Standard Deviation = 6 Path 1-2-5 Mean Time = Standard Deviation =10 Path 1 - 3 - 4 - 5 Activity B.........te Standard Deviation = Activity C.........te = Standard Deviation = Activity D.........te = Standard Deviation = Activity E.........te = Standard Deviation = 6 Path 1-2-5 Mean Time = Standard Deviation =10 Path 1-3-4-5 Mean Time = Standard Deviation =

Step by Step Solution

There are 3 Steps involved in it

1 Expert Approved Answer
Step: 1 Unlock blur-text-image
Question Has Been Solved by an Expert!

Get step-by-step solutions from verified subject matter experts

Step: 2 Unlock
Step: 3 Unlock

Students Have Also Explored These Related General Management Questions!