

Question: Given the Activity on Arrow Diagram and the data found in the table above. calculate each of the following values: Activity A ( t_{e}=43 )
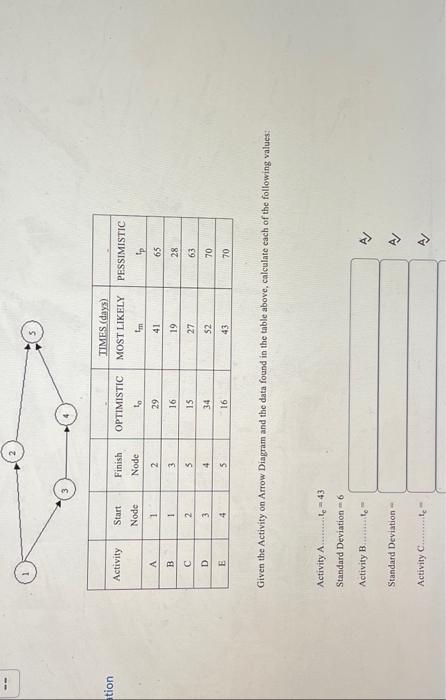

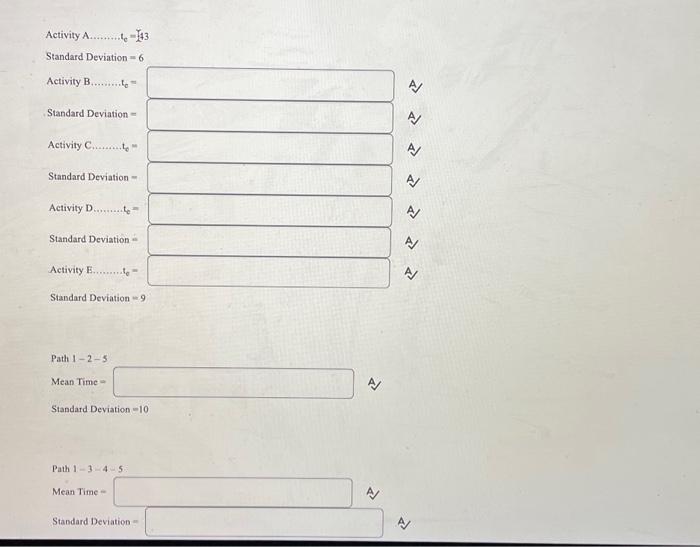
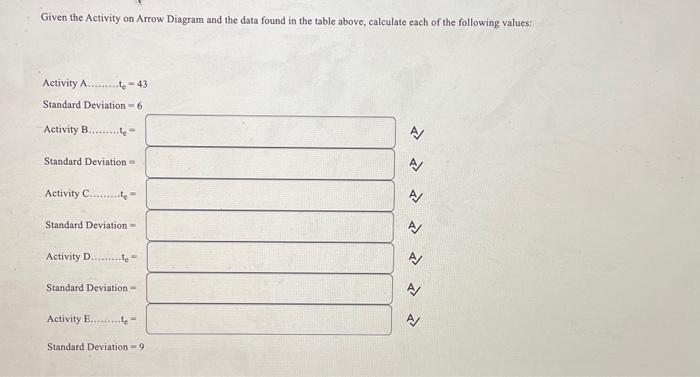
Given the Activity on Arrow Diagram and the data found in the table above. calculate each of the following values: Activity A \( t_{e}=43 \) Standard Deviation \( =6 \) Given the Activity on Arrow Di 

Step by Step Solution
There are 3 Steps involved in it
1 Expert Approved Answer
Step: 1 Unlock

Question Has Been Solved by an Expert!
Get step-by-step solutions from verified subject matter experts
Step: 2 Unlock
Step: 3 Unlock