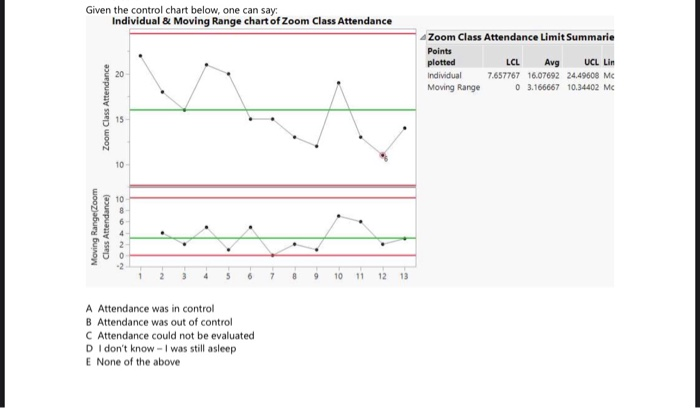
Question: Given the control chart below, one can say: Individual & Moving Range chart of Zoom Class Attendance Zoom Class Attendance Limit Summarie Points plotted LCL

Given the control chart below, one can say:
Given the control chart below, one can say: Individual & Moving Range chart of Zoom Class Attendance Zoom Class Attendance Limit Summarie Points plotted LCL Avg UCL Lin Individual 7.657767 16.07692 24.49608 MC Moving Range 03.166667 10.34402 MC Zoom Class Attendance Moving Range(Zoom Class Attendance) 3 4 5 6 7 8 9 10 11 12 13 A Attendance was in control B Attendance was out of control C Attendance could not be evaluated D I don't know - I was still asleep E None of the above

Step by Step Solution

There are 3 Steps involved in it

1 Expert Approved Answer
Step: 1 Unlock blur-text-image
Question Has Been Solved by an Expert!

Get step-by-step solutions from verified subject matter experts

Step: 2 Unlock
Step: 3 Unlock

Students Have Also Explored These Related General Management Questions!