

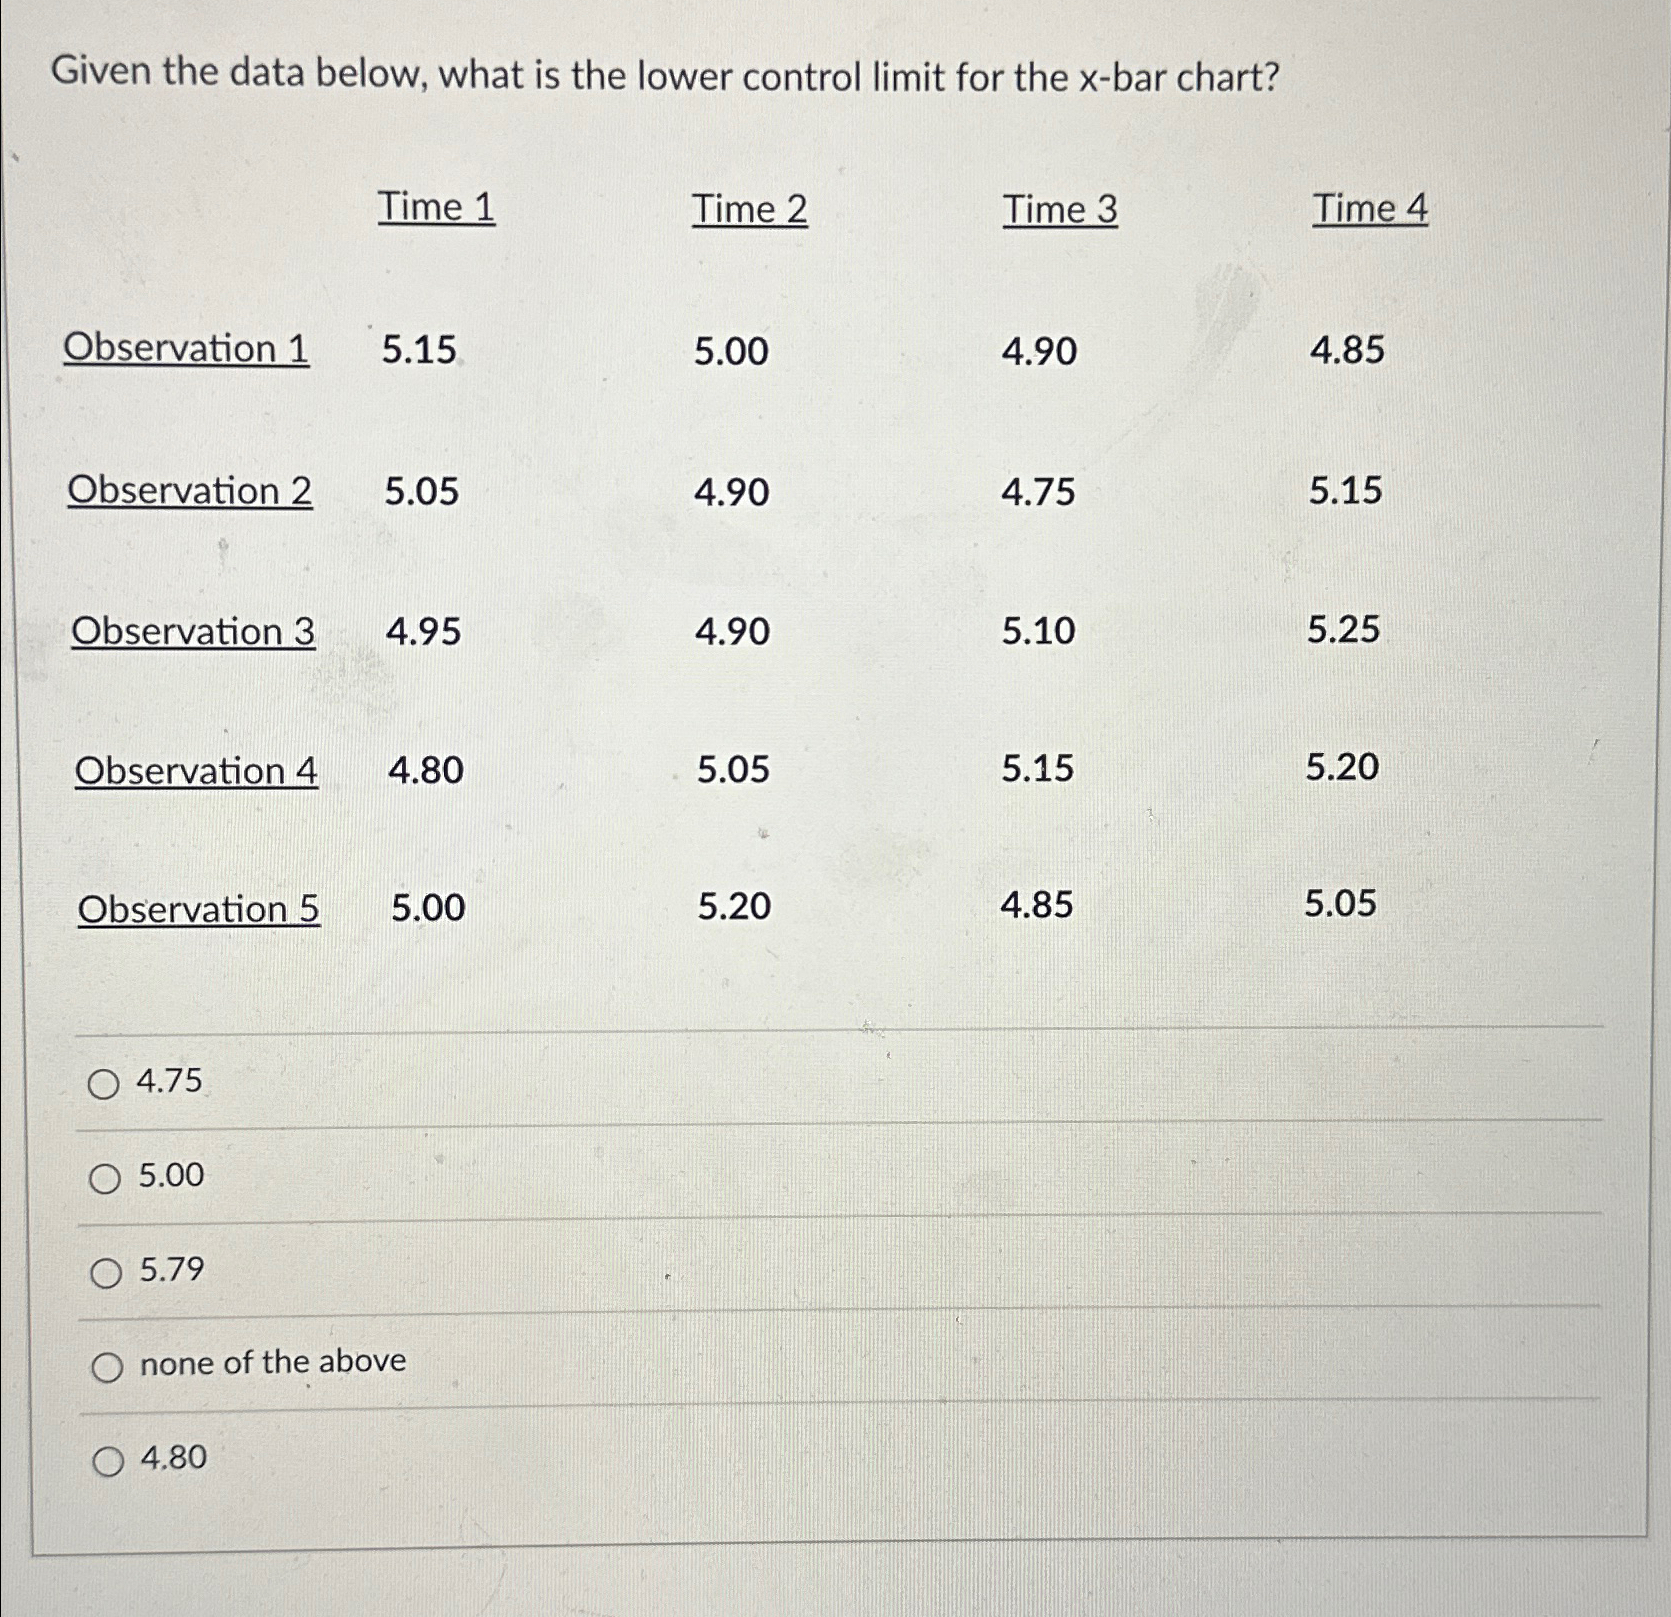
Question: Given the data below, what is the lower control limit for the x - bar chart? table [ [ , Time 1 , Time
Given the data below, what is the lower control limit for the bar chart?
tableTime Time Time Time Observation Observation Observation Observation Observation none of the above,,,,
Step by Step Solution
There are 3 Steps involved in it
1 Expert Approved Answer
Step: 1 Unlock

Question Has Been Solved by an Expert!
Get step-by-step solutions from verified subject matter experts
Step: 2 Unlock
Step: 3 Unlock