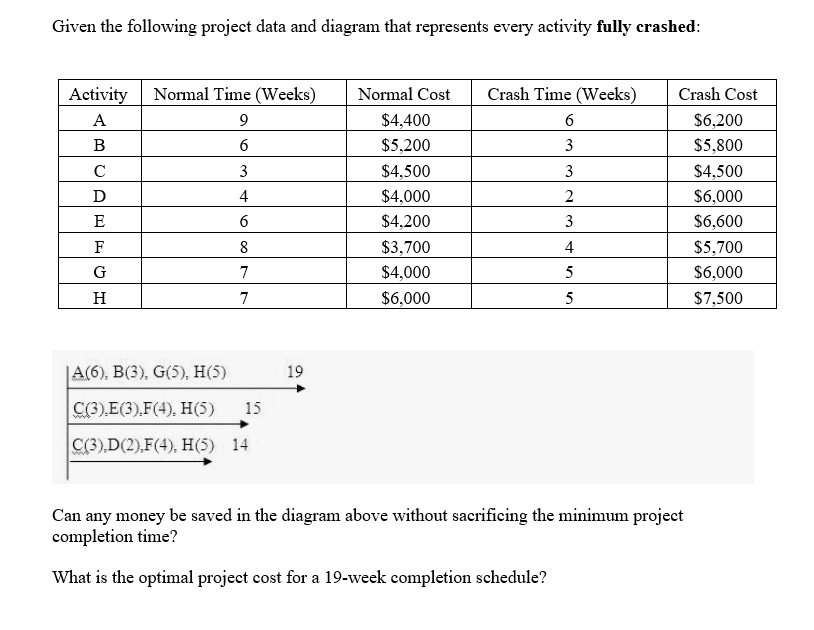
Question: Given the following project data and diagram that represents every activity fully crashed: Activity A B Normal Time (Weeks) 9 6 3 D E F

Given the following project data and diagram that

Given the following project data and diagram that represents every activity fully crashed: Activity A B Normal Time (Weeks) 9 6 3 D E F G H Normal Cost $4,400 $5,200 $4,500 $4,000 $4,200 $3,700 $4,000 $6,000 4 6 8 7 Crash Time (Weeks) 6 3 3 2 3 4 5 5 Crash Cost $6,200 $5,800 $4,500 $6,000 $6,600 $5,700 $6.000 $7,500 6 8 4 7 A(6), B(3), G(5), H(5) 19 C(3),E(3).F(4), H(5) 15 C(3),D(2),F(4), H(5) 14 Can any money be saved in the diagram above without sacrificing the minimum project completion time? What is the optimal project cost for a 19-week completion schedule

Step by Step Solution

There are 3 Steps involved in it

1 Expert Approved Answer
Step: 1 Unlock blur-text-image
Question Has Been Solved by an Expert!

Get step-by-step solutions from verified subject matter experts

Step: 2 Unlock
Step: 3 Unlock

Students Have Also Explored These Related General Management Questions!