

Question: Given the mean absolute deviation for the four forecasting methods shown in the table, which forecasting method is performing best? table [ [ ,
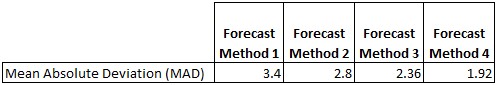
Given the mean absolute deviation for the four forecasting methods shown in the table, which forecasting method is performing best?
tabletableForecastMethod tableForecastMethod tableForecastMethod tableForecastMethod Mean Absolute Deviation MAD
Step by Step Solution
There are 3 Steps involved in it
1 Expert Approved Answer
Step: 1 Unlock

Question Has Been Solved by an Expert!
Get step-by-step solutions from verified subject matter experts
Step: 2 Unlock
Step: 3 Unlock