

Question: Given the model below: Period 1 2 3 4 5 6 7 8 9 10 11 Demand100 130 140 160 170 190 180 170 130
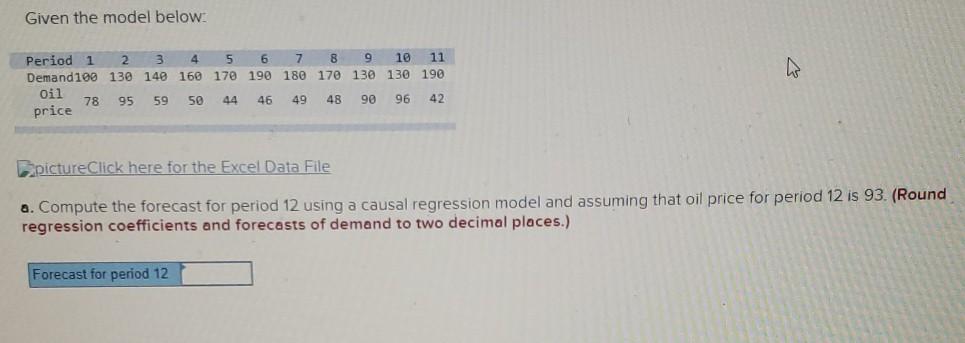
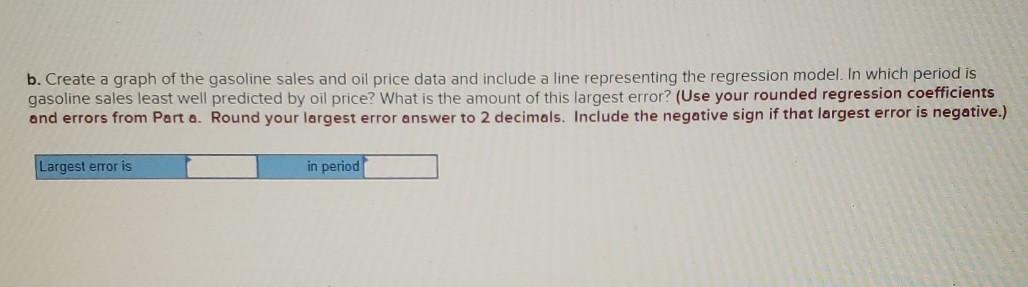
Given the model below: Period 1 2 3 4 5 6 7 8 9 10 11 Demand100 130 140 160 170 190 180 170 130 130 190 Oil 78 95 59 50 44 46 49 48 90 96 42 price PpictureClick here for the Excel Data File a. Compute the forecast for period 12 using a causal regression model and assuming that oil price for period 12 is 93. (Round regression coefficients and forecasts of demand to two decimal places.) Forecast for period 12 b. Create a graph of the gasoline sales and oil price data and include a line representing the regression model. In which period is gasoline sales least well predicted by oil price? What is the amount of this largest error? (Use your rounded regression coefficients and errors from Parta. Round your largest error answer to 2 decimals. Include the negative sign if that largest error is negative.) Largest error is in period
Step by Step Solution
There are 3 Steps involved in it
1 Expert Approved Answer
Step: 1 Unlock

Question Has Been Solved by an Expert!
Get step-by-step solutions from verified subject matter experts
Step: 2 Unlock
Step: 3 Unlock