

Question: Given the previous analyses based on the observed inter-arrival times between the orders and the times to process them (see the two spreadsheets provided in
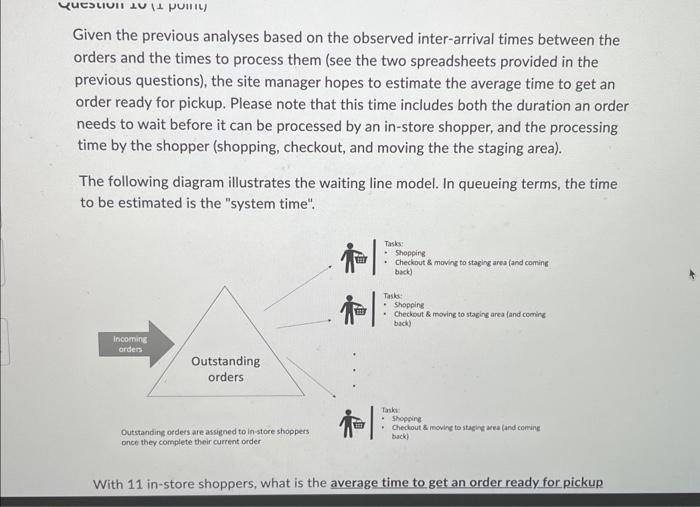
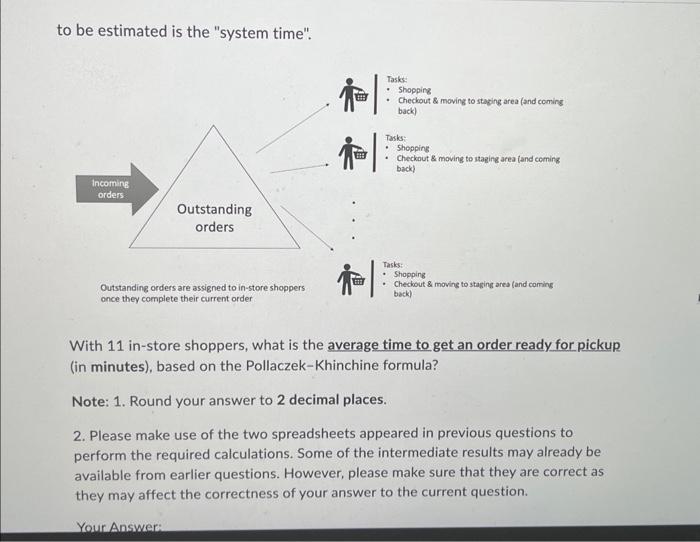
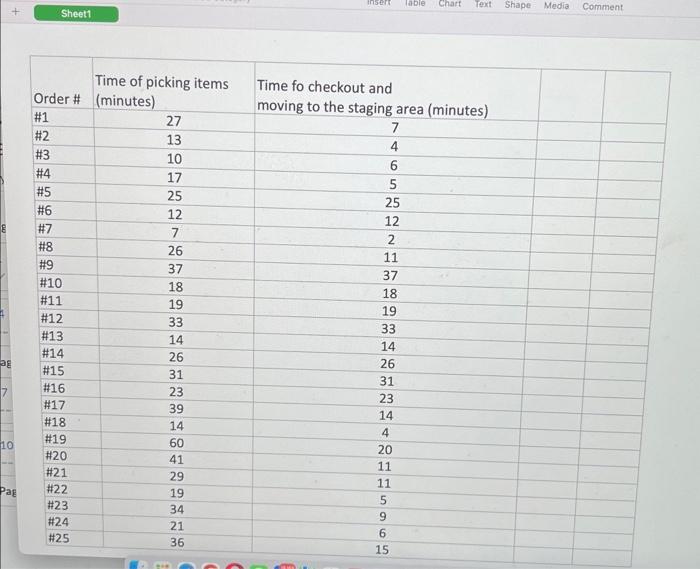
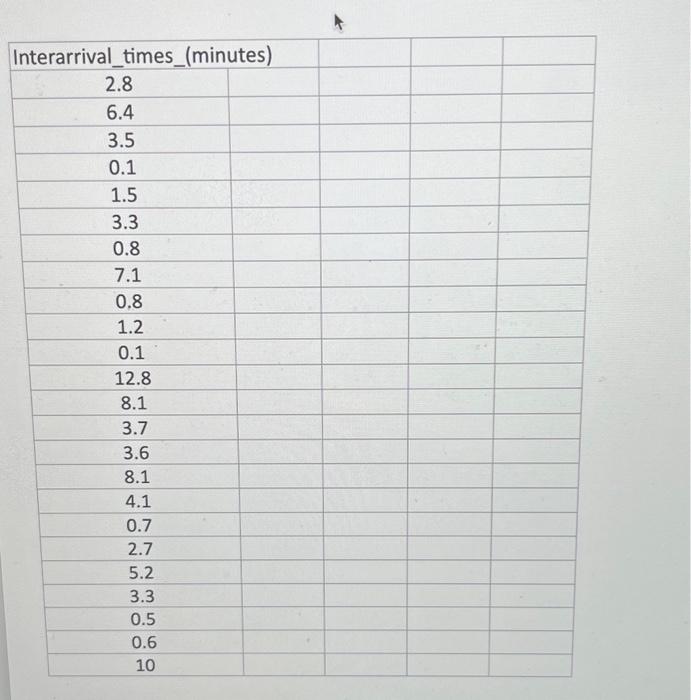
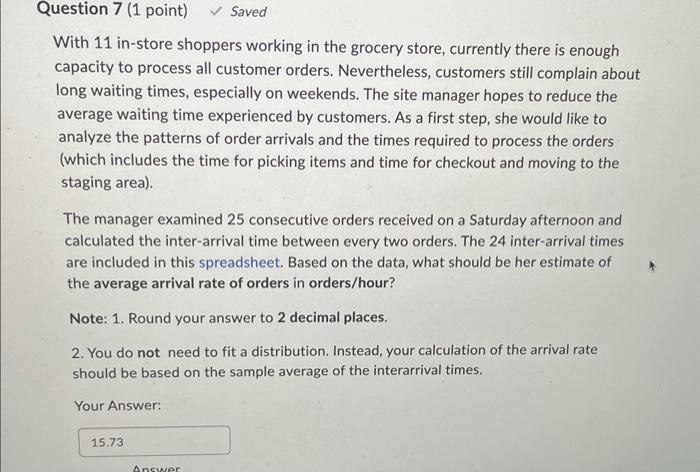
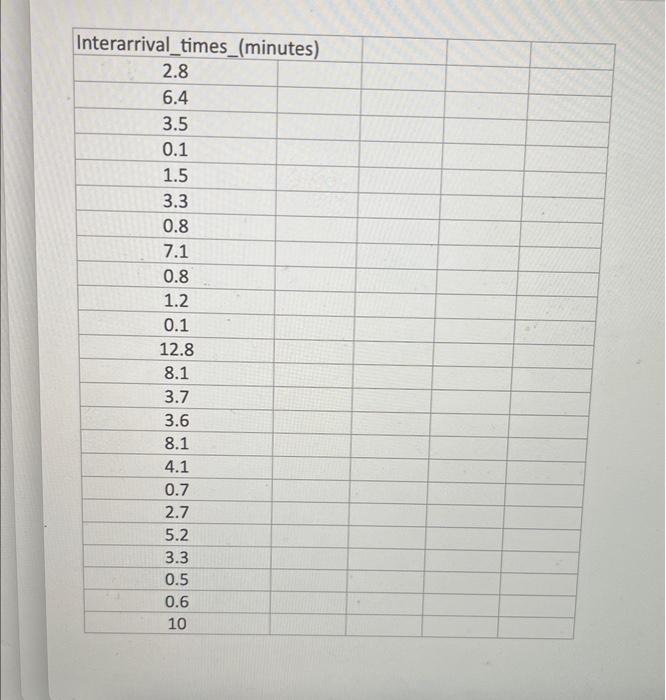
Given the previous analyses based on the observed inter-arrival times between the orders and the times to process them (see the two spreadsheets provided in the previous questions), the site manager hopes to estimate the average time to get an order ready for pickup. Please note that this time includes both the duration an order needs to wait before it can be processed by an in-store shopper, and the processing time by the shopper (shopping, checkout, and moving the the staging area). The following diagram illustrates the waiting line model. In queueing terms, the time to be estimated is the "system time". With 11 in-store shoppers, what is the average time to get an order ready for pickup to be estimated is the "system time". With 11 in-store shoppers, what is the average time to get an order ready for pickup (in minutes), based on the Pollaczek-Khinchine formula? Note: 1 . Round your answer to 2 decimal places. 2. Please make use of the two spreadsheets appeared in previous questions to perform the required calculations. Some of the intermediate results may already be available from earlier questions. However, please make sure that they are correct as they may affect the correctness of your answer to the current question. Interarrival_times_(minutes) \begin{tabular}{|c} \hline 2.8 \\ 6.4 \\ 3.5 \\ 0.1 \\ 1.5 \\ 3.3 \\ 0.8 \\ 7.1 \\ 0.8 \\ 1.2 \\ \hline 0.1 \\ 12.8 \\ \hline 8.1 \\ 3.7 \\ \hline 3.6 \\ \hline 8.1 \\ 4.1 \\ 0.7 \\ 2.7 \\ 5.2 \\ \hline 3.3 \\ 0.5 \\ \hline 0.6 \\ \hline 10 \end{tabular} With 11 in-store shoppers working in the grocery store, currently there is enough capacity to process all customer orders. Nevertheless, customers still complain about long waiting times, especially on weekends. The site manager hopes to reduce the average waiting time experienced by customers. As a first step, she would like to analyze the patterns of order arrivals and the times required to process the orders (which includes the time for picking items and time for checkout and moving to the staging area). The manager examined 25 consecutive orders received on a Saturday afternoon and calculated the inter-arrival time between every two orders. The 24 inter-arrival times are included in this spreadsheet. Based on the data, what should be her estimate of the average arrival rate of orders in orders/hour? Note: 1 . Round your answer to 2 decimal places. 2. You do not need to fit a distribution. Instead, your calculation of the arrival rate should be based on the sample average of the interarrival times. Your Answer: Interarrival_times_(minutes) 2.86.43.50.11.53.30.87.10.81.20.112.88.13.73.68.14.10.72.75.23.30.50.610
Step by Step Solution
There are 3 Steps involved in it

Get step-by-step solutions from verified subject matter experts