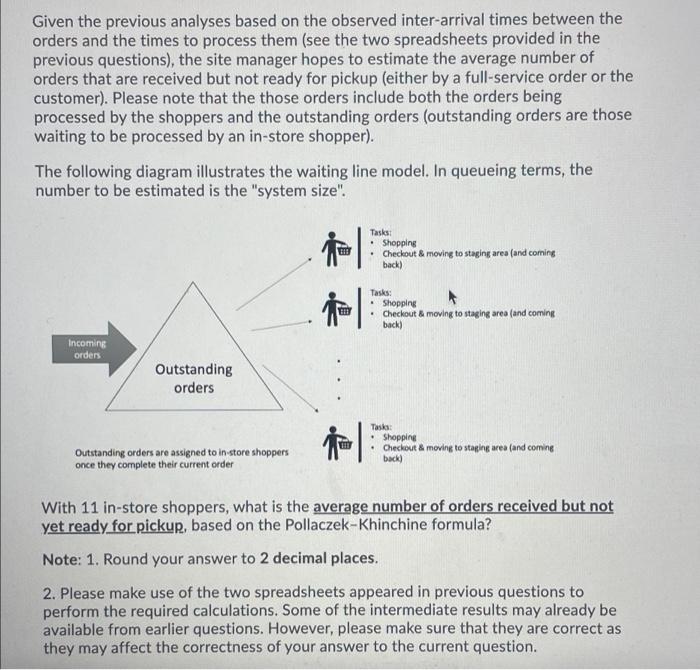
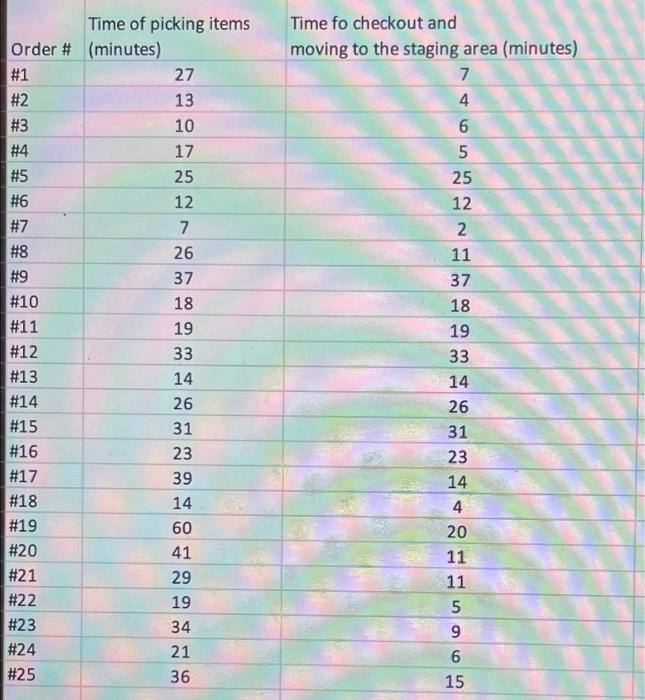
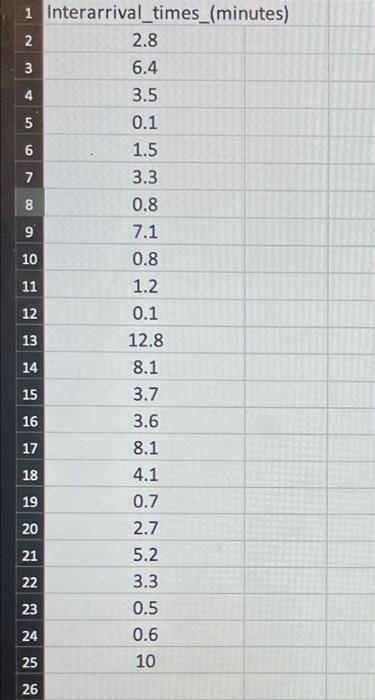
Question: Given the previous analyses based on the observed inter-arrival times between the orders and the times to process them (see the two spreadsheets provided in

Given the previous analyses based on the observed
Given the previous analyses based on the observed inter-arrival times between the orders and the times to process them (see the two spreadsheets provided in the previous questions), the site manager hopes to estimate the average number of orders that are received but not ready for pickup (either by a full-service order or the customer). Please note that the those orders include both the orders being processed by the shoppers and the outstanding orders (outstanding orders are those waiting to be processed by an in-store shopper). The following diagram illustrates the waiting line model. In queueing terms, the number to be estimated is the "system size". pl Tasks: Shopping Checkout & moving to staging area and coming back) Tasks: Shopping Checkout & moving to staging area (and coming back) Incoming orders Outstanding orders Taska: Shopping Checkout & moving to staping area (and coming Outstanding orders are assigned to in store shoppers once they complete their current order back) With 11 in-store shoppers, what is the average number of orders received but not yet ready for pickup, based on the Pollaczek-Khinchine formula? Note: 1. Round your answer to 2 decimal places. 2. Please make use of the two spreadsheets appeared in previous questions to perform the required calculations. Some of the intermediate results may already be available from earlier questions. However, please make sure that they are correct as they may affect the correctness of your answer to the current question. Time fo checkout and moving to the staging area (minutes) 7 4 6 5 #2 25 12 2 11 Time of picking items Order # (minutes) #1 27 13 #3 10 #4 17 #5 25 #6 12 #7 7 #8 26 #9 37 #10 18 #11 19 #12 33 #13 14 #14 26 #15 31 #16 23 #17 39 #18 14 #19 60 #20 41 #21 29 #22 19 #23 34 #24 21 #25 36 37 18 19 33 14 26 31 23 14 4 20 11 11 5 9 6 15 N 2 3 4 5 9 1 Interarrival_times_(minutes) 2.8 6.4 3.5 5 0.1 6 1.5 7 3.3 8 0.8 9 7.1 10 0.8 11 1.2 12 0.1 13 12.8 14 8.1 3.7 16 3.6 8.1 18 4.1 19 0.7 20 2.7 21 5.2 22 3.3 23 0.5 0.6 25 10 15 17 99 24 26

Step by Step Solution

There are 3 Steps involved in it

1 Expert Approved Answer
Step: 1 Unlock blur-text-image
Question Has Been Solved by an Expert!

Get step-by-step solutions from verified subject matter experts

Step: 2 Unlock
Step: 3 Unlock

Students Have Also Explored These Related General Management Questions!