

Question: Given the table and information below: Activity Dependency Duration Start A Start 4 B Start 5 O A 4 D A 5 E A 3
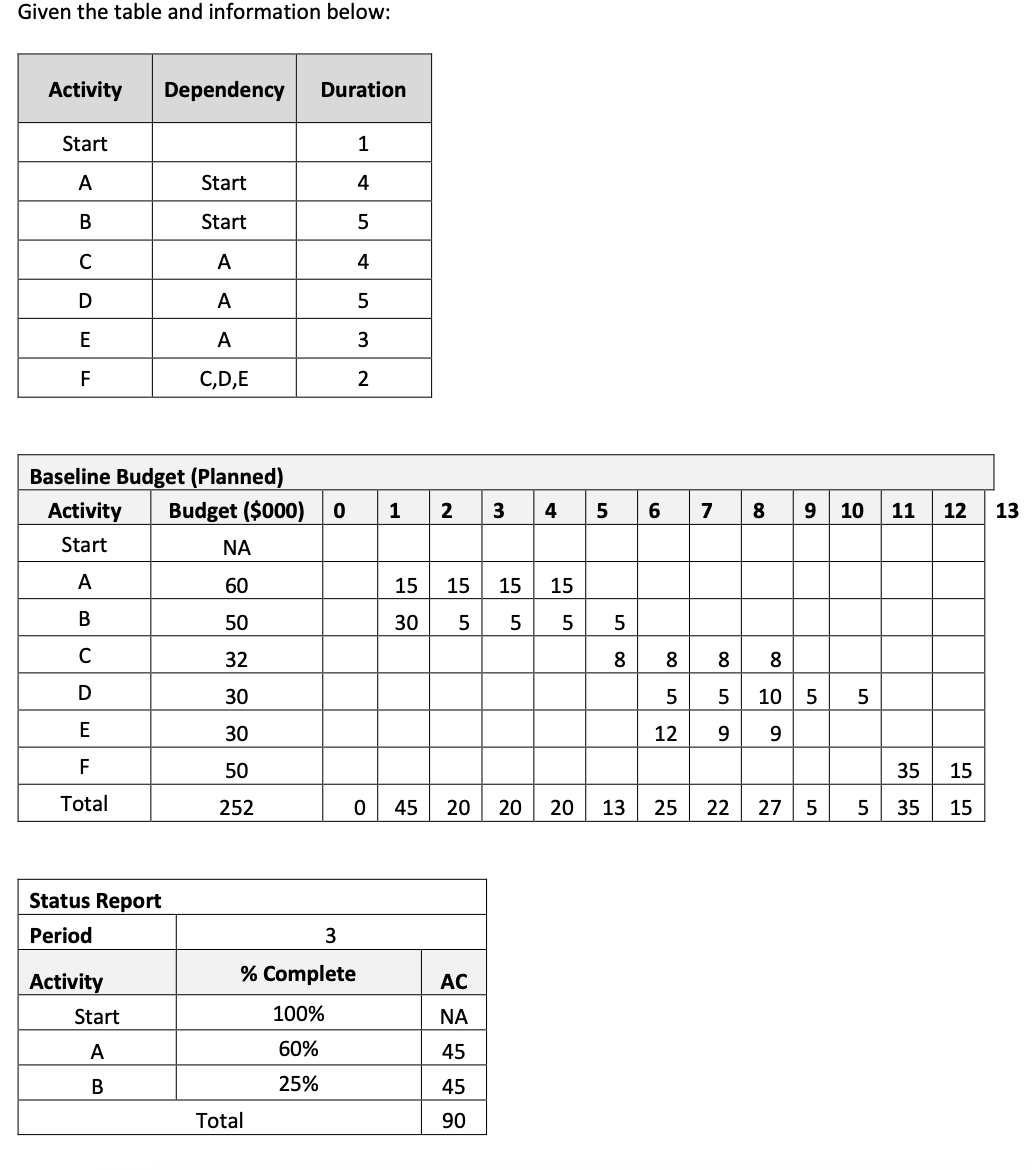
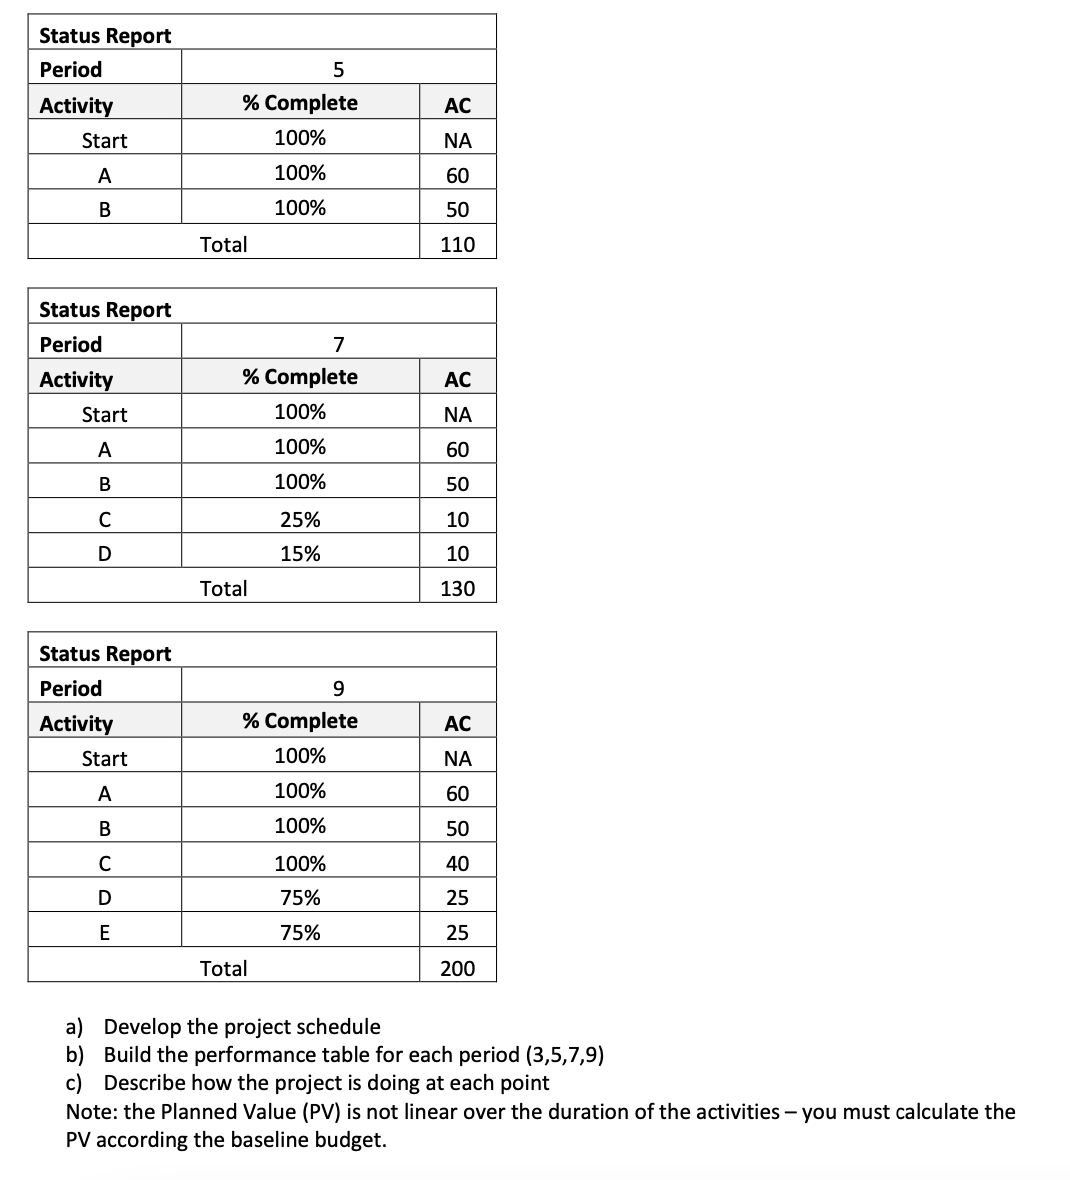
Given the table and information below: Activity Dependency Duration Start A Start 4 B Start 5 O A 4 D A 5 E A 3 F C,D,E 2 Baseline Budget (Planned) Activity Budget ($000) 0 1 2 3 4 5 6 7 8 9 10 11 12 13 Start NA A 60 15 15 15 15 B 50 30 5 5 5 5 C 32 8 D 30 5 5 10 5 5 E 30 12 9 F 50 35 15 Total 252 0 45 20 20 |20 13 25 22 27 5 5 35 15 Status Report Period 3 Activity % Complete AC Start 100% NA A 60% 45 B 25% 45 Total 90Status Report Period 5 Activity % Complete Ac l Sta rt 100% N A l A 100% 50 B 100% 50 Total 110 Status Report Period 7 | Activity % Complete AC I Start 100% N A 100% I Total 130 Status Report 9 % Complete AC 100% N A 100% 50 100% 50 100% 40 75% 25 75% 25 Total 200 a) Develop the project schedule b) Build the performance table for each period (3,519) c) Describe how the project is doing at each point Note: the Planned Value (PV) is not linear over the duration of the activities you must calculate the PV according the baseline budget
Step by Step Solution
There are 3 Steps involved in it

Get step-by-step solutions from verified subject matter experts