

Question: Graphing a straight-line function Suppose an experiment was done to determine how long it would take to heat a small amount of water to its
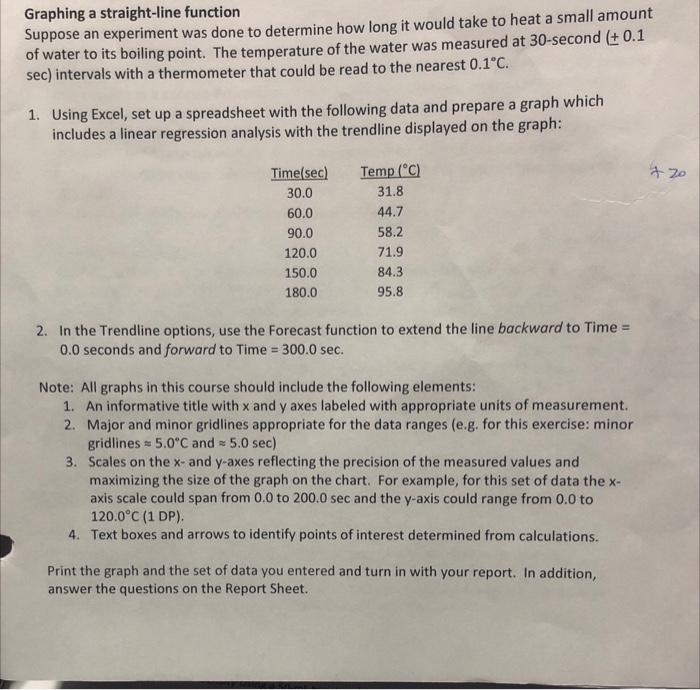
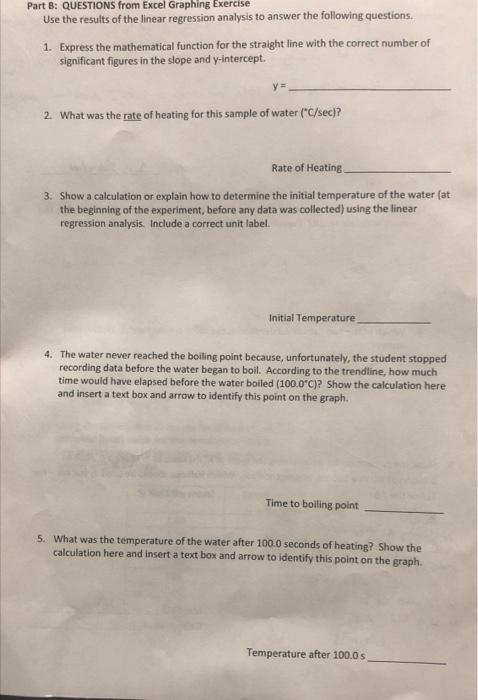
Graphing a straight-line function Suppose an experiment was done to determine how long it would take to heat a small amount of water to its boiling point. The temperature of the water was measured at 30-second(+ 0.1 sec) intervals with a thermometer that could be read to the nearest 0.1C. 1. Using Excel, set up a spreadsheet with the following data and prepare a graph which includes a linear regression analysis with the trendline displayed on the graph: 420 Time(sec) 30.0 60.0 90.0 120.0 150.0 180.0 Temp (C) 31.8 44.7 58.2 71.9 84.3 95.8 2. In the Trendline options, use the Forecast function to extend the line backward to Time = 0.0 seconds and forward to Time = 300.0 sec. Note: All graphs in this course should include the following elements: 1. An informative title with x and y axes labeled with appropriate units of measurement. 2. Major and minor gridlines appropriate for the data ranges (e.g. for this exercise: minor gridlines - 5.0"C and 5.0 sec) 3. Scales on the x- and y-axes reflecting the precision of the measured values and maximizing the size of the graph on the chart. For example, for this set of data the X- axis scale could span from 0.0 to 200.0 sec and the y-axis could range from 0.0 to 120.0C (1 DP). 4. Text boxes and arrows to identify points of interest determined from calculations. Print the graph and the set of data you entered and turn in with your report. In addition, answer the questions on the Report Sheet. Part 8: QUESTIONS from Excel Graphing Exercise Use the results of the linear regression analysis to answer the following questions. 1. Express the mathematical function for the straight line with the correct number of significant figures in the slope and y-intercept. 2. What was the rate of heating for this sample of water ("C/sec)? Rate of Heating 3. Show a calculation or explain how to determine the initial temperature of the water (at the beginning of the experiment, before any data was collected) using the linear regression analysis. Include a correct unit label Initial Temperature 4. The water never reached the boiling point because, unfortunately, the student stopped recording data before the water began to boil. According to the trendline, how much time would have elapsed before the water boiled (100.0*C)? Show the calculation here and insert a text box and arrow to identify this point on the graph. Time to boiling point 5. What was the temperature of the water after 100.0 seconds of heating? Show the calculation here and insert a text box and arrow to identify this point on the graph. Temperature after 100.0
Step by Step Solution
There are 3 Steps involved in it

Get step-by-step solutions from verified subject matter experts