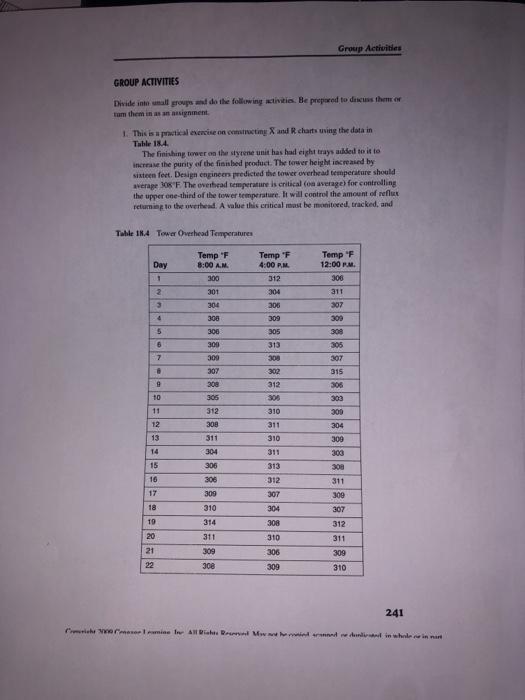
Question: Group Activities GROUP ACTIVITIES Divide inte all groups and do the following this. Be prepoved to discuss theme tum them in assignment 1. This is

Group Activities GROUP ACTIVITIES Divide inte all
Group Activities GROUP ACTIVITIES Divide inte all groups and do the following this. Be prepoved to discuss theme tum them in assignment 1. This is a practical exercise on constructing X and R charts wing the data in Tahle 18.4 The finishing tower on the styrene unit has had eight trays added to it to increase the punity of the finished product. The tower height increased by sixteen feet. Design engineer predicted the tower overhead temperature should average 30%" The overhead temperature is critical con average) for controlling the upper one-third of the tower temperature. It will control the amount of reflux reluminto the overhead. A value this critical must be monitored, tracked, and Table 18.4 Tower Overhead Temperatures Temp "F Day Temp "F 8:00 AM 300 301 4:00 PM 312 Temp "F 12:00 PM 306 311 307 2 304 3 304 306 300 300 309 305 5 309 305 6 300 300 307 313 300 7 307 302 315 306 9 308 305 to 309 312 305 310 311 11 300 312 308 304 12 13 310 309 14 15 308 16 311 304 306 306 309 310 314 313 312 307 304 308 311 309 17 18 310 311 309 307 312 311 309 310 21 306 309 22 308 241 me molemine In A B wird und in whole in na Chapter 18 SPC and Control Charts recorded. It also should have a control chart. The unit engineer assigned a crew to gather data to be used to construct the control chart. The unit crews took a thermocouple reading at the top of the tower every eight hours (some of the crew lost weight climbing the eighty-foot tower), and recorded it on a check sheet After twenty-two subsets of data were collected the engineer asked the crew to create a control chart on paper for him to look at. He would verify the data and calculations, and if they were okay, he would input the data into the unit engineering station and create a control chart online. The data collected are shown in Table 18.4. 1. Write a short paragraph telling the engineer what the control chart reveals about the tower overhead temperature population, b. Use the data in Table 18.4 to construct an SPC chart for the engineer Remember, this is part of the job for continuous improvement. It is not just the engineer's or management's unit, it is the crew's unit also. For the unit to remain in production, it must show a profit. The SPC chart created is one way to maintain on-specification product and to prevent rework and wasted resources

Step by Step Solution

There are 3 Steps involved in it

1 Expert Approved Answer
Step: 1 Unlock blur-text-image
Question Has Been Solved by an Expert!

Get step-by-step solutions from verified subject matter experts

Step: 2 Unlock
Step: 3 Unlock

Students Have Also Explored These Related General Management Questions!