

Question: Have no idea where to start :( Home Insert Draw Page Layout Formulas Data Review View Shape Format Tell me Share Comments Calibri (Body) '
Have no idea where to start :(
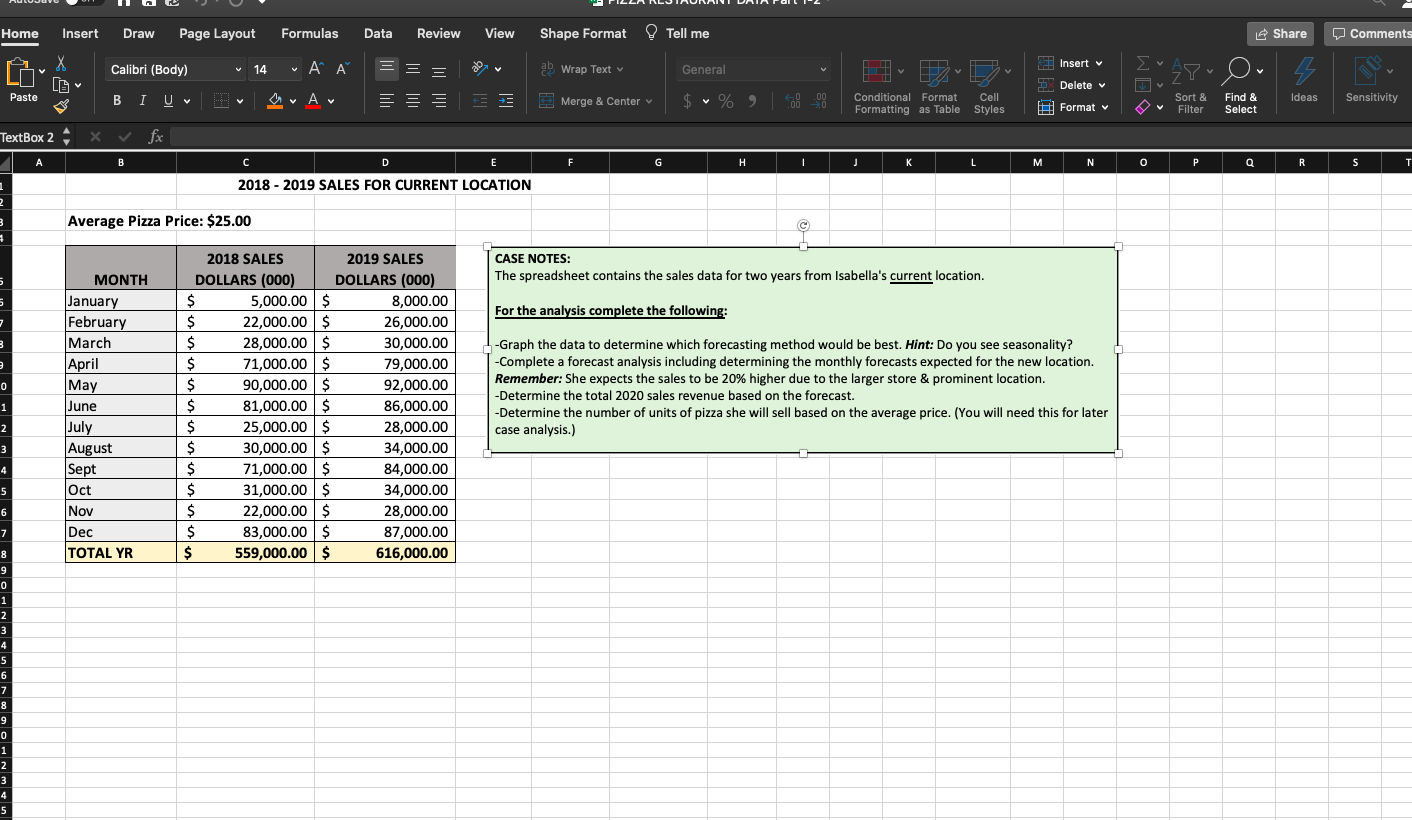
Home Insert Draw Page Layout Formulas Data Review View Shape Format Tell me Share Comments Calibri (Body) ' 14 ab Wrap Text = = = General Insert v Delete v Or 5 IA Paste BIU a. Av 5 V Merge & Center v $ % 3 o o V Ideas Conditional Format Cell Formatting as Table Styles Sort & Filter Format v Sensitivity Find & Select V TextBox 2 A B D E F F G H J K L M N 0 P Q R S T 2018 - 2019 SALES FOR CURRENT LOCATION 1 2 Average Pizza Price: $25.00 CASE NOTES: The spreadsheet contains the sales data for two years from Isabella's current location. 5 5 For the analysis complete the following: 7 3 0 MONTH January February March April May June July August Sept Oct Nov Dec TOTAL YR 1 2018 SALES 2019 SALES DOLLARS (000) DOLLARS (000) $ 5,000.00 $ 8,000.00 $ 22,000.00 $ 26,000.00 $ 28,000.00 $ 30,000.00 $ 71,000.00 $ 79,000.00 $ 90,000.00 $ 92,000.00 $ 81,000.00 $ 86,000.00 $ 25,000.00 $ 28,000.00 $ 30,000.00 $ 34,000.00 $ 71,000.00 $ 84,000.00 $ 31,000.00 $ 34,000.00 $ 22,000.00 $ 28,000.00 $ 83,000.00 $ 87,000.00 $ 559,000.00 $ 616,000.00 -Graph the data to determine which forecasting method would be best. Hint: Do you see seasonality? -Complete a forecast analysis including determining the monthly forecasts expected for the new location. Remember: She expects the sales to be 20% higher due to the larger store & prominent location. -Determine the total 2020 sales revenue based on the forecast. -Determine the number of units of pizza she will sell based on the average price. (You will need this for later case analysis.) 2 3 4 5 6 7 8 9 0 1 2 3 4 5 6 7 8 9 0 1 2 3 4 5Step by Step Solution
There are 3 Steps involved in it
1 Expert Approved Answer
Step: 1 Unlock

Question Has Been Solved by an Expert!
Get step-by-step solutions from verified subject matter experts
Step: 2 Unlock
Step: 3 Unlock