

Question: he following statistical software output is for a regression o flexural strength (measured in MPa) of concrete beams on modulus of elasticity (measured in GPa).
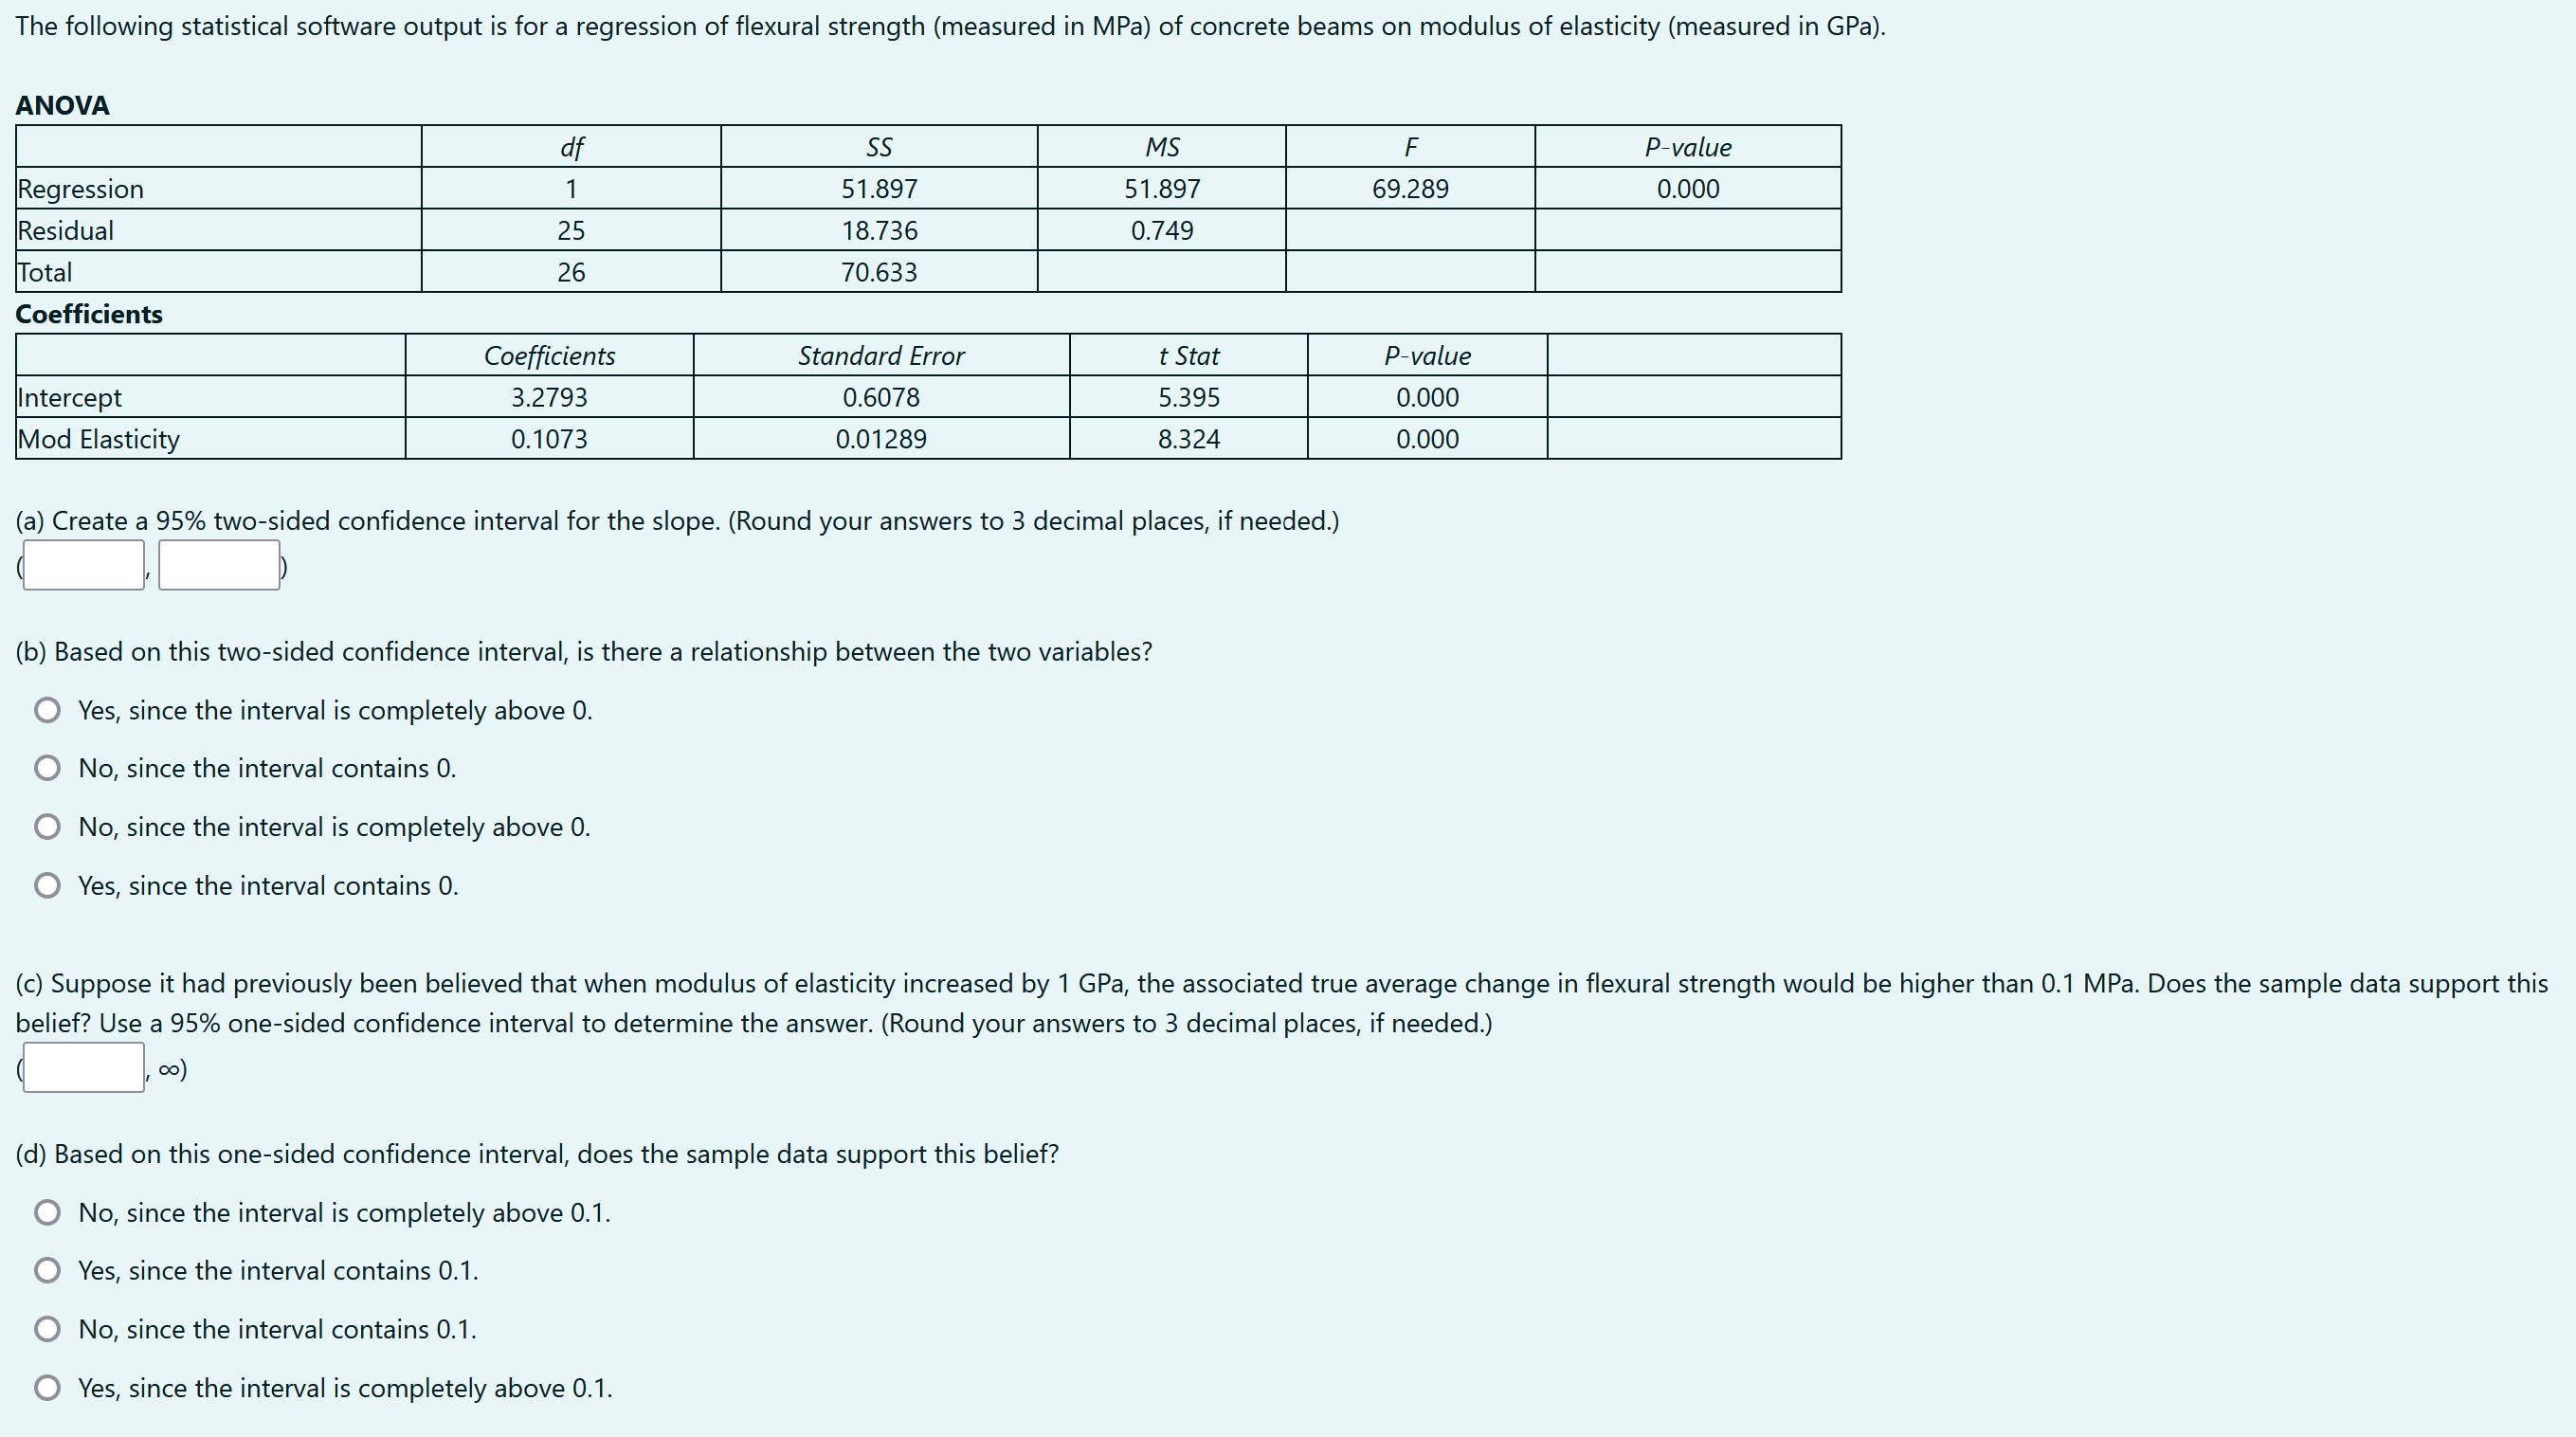
he following statistical software output is for a regression o flexural strength (measured in MPa) of concrete beams on modulus of elasticity (measured in GPa). ANOVA df 55 MS F Pavalue Regression 1 51.897 51.897 69.289 0.000 Residual 25 18.736 0.749 Total 26 70.633 Coefficients Coefcients Standard Error tStat P value ntercept 3.2793 0.6078 5.395 0.000 Mod Elasticity 0.1073 0.01289 8324 0.000 (a) Create a 95% twoesided confidence interval for the slope. (Round your answers to 3 decimal places, if needed.) (b) Based on this two-sided confidence interval, is there a relationship between the two variables? 0 Yes, Since the interval is completely above 0. O No, since the interval contains 0. O No, since the interval is completely above 0. 0 Yes, since the inteNal contains 0. (c) Suppose it had previously been believed that when modulus of elasticity increased by 1 GPa, the associated true average change in flexural strength would be higher than 0.1 MPa. Does the sample data support this belief? Use a 95% one-sided confidence interval to determine the answer. (Round your answers to 3 decimal places, if needed.) .) (d) Based on this one-sided confidence interval, does the sample data support this belief? O No, since the interval is completely above 0.1. 0 Yes, since the interval contains 0.1, O No, since the interval contains 0.1. 0 Yes, since the inteNal is completely above 0.1
Step by Step Solution
There are 3 Steps involved in it

Get step-by-step solutions from verified subject matter experts