

Question: solve and help with wrong answers The following statistical software output is for a regression of flexural strength (measured in MPa) of concrete beams on
solve and help with wrong answers
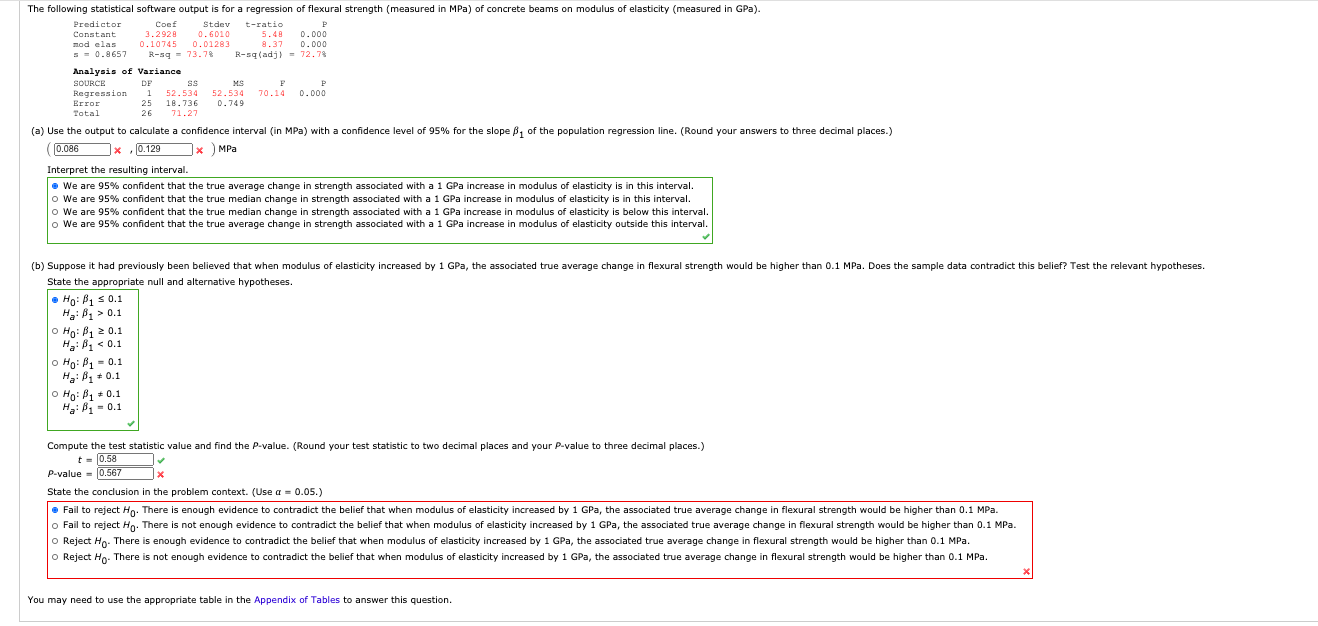
The following statistical software output is for a regression of flexural strength (measured in MPa) of concrete beams on modulus of elasticity (measured in GPa). Predictor Conf Stdev t-ratio P Constant 3.2928 0. 6010 5.48 D. DOO nod elas 0. 10745 0. 01283 8.37 D . DOO 5 = 0.8657 R-sq = 73.78 R-sq (adj) = 72.7$ Analysis of Variance SOURCE OF MS Regression 1 52.534 52.534 70.14 D. DOO Error 25 18 . 736 D. 749 Total 26 71.27 (a) Use the output to calculate a confidence interval (in MPa) with a confidence level of 95% for the slope , of the population regression line. (Round your answers to three decimal places.) 0.086 * , 0.129 1 x ) MPa Interpret the resulting interval. We are 95% confident that the true average change in strength associated with a 1 GPa increase in modulus of elasticity is in this interval. O We are 95% confident that the true median change in strength associated with a 1 GPa increase in modulus of elasticity is in this interval. O We are 95% confident that the true median change in strength associated with a 1 GPa increase in modulus of elasticity is below this interval. o We are 95% confident that the true average change in strength associated with a 1 GPa increase in modulus of elasticity outside this interval. (b) Suppose it had previously been believed that when modulus of elasticity increased by 1 GPa, the associated true average change in flexural strength would be higher than 0.1 MPa. Does the sample data contradict this belief? Test the relevant hypotheses. State the appropriate null and alternative hypotheses. . Ho: B1 5 0.1 Ha: P, > 0.1 O Ho: By 2 0.1 Ha! By o O HO: B1 = 0 Ha: P1 0.10 0 0.05 0.10 o 0.05
Step by Step Solution
There are 3 Steps involved in it

Get step-by-step solutions from verified subject matter experts