

Question: Question 4 The following statistical software output is for a regression of flexural strength (measured in MPa) of concrete beams on modulus of elasticity
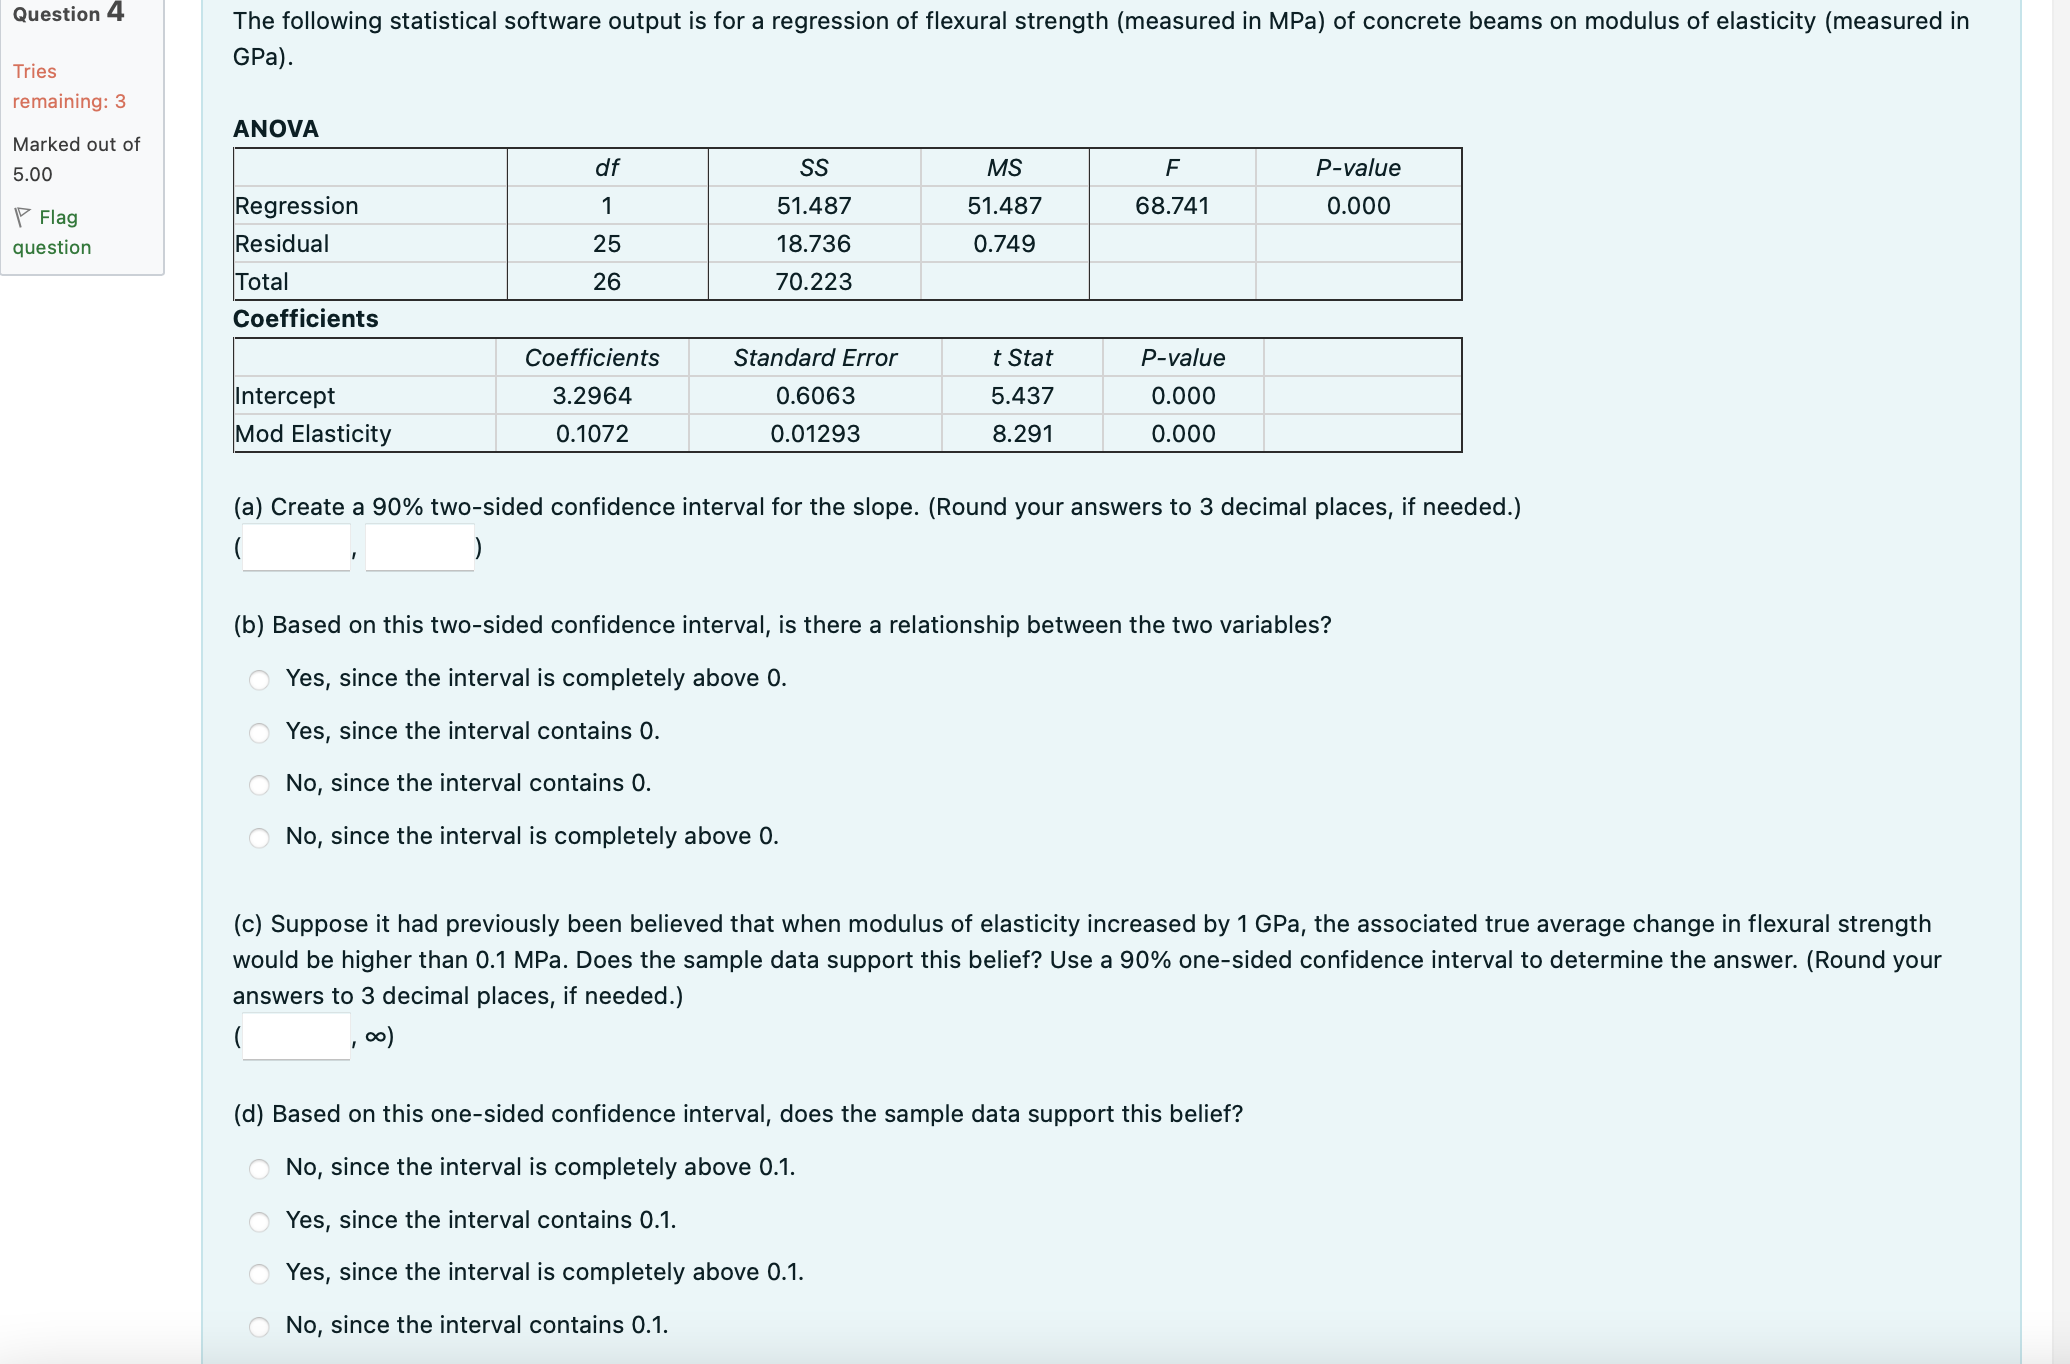
Question 4 The following statistical software output is for a regression of flexural strength (measured in MPa) of concrete beams on modulus of elasticity (measured in GPa). Tries remaining: 3 ANOVA Marked out of 5.00 Flag question df SS MS F P-value Regression 1 51.487 Residual 25 18.736 51.487 0.749 68.741 0.000 Total 26 70.223 Coefficients Intercept Mod Elasticity Coefficients 3.2964 0.1072 Standard Error t Stat P-value 0.6063 0.01293 5.437 8.291 0.000 0.000 (a) Create a 90% two-sided confidence interval for the slope. (Round your answers to 3 decimal places, if needed.) ( ) (b) Based on this two-sided confidence interval, is there a relationship between the two variables? Yes, since the interval is completely above 0. Yes, since the interval contains 0. No, since the interval contains O. No, since the interval is completely above 0. (c) Suppose it had previously been believed that when modulus of elasticity increased by 1 GPa, the associated true average change in flexural strength would be higher than 0.1 MPa. Does the sample data support this belief? Use a 90% one-sided confidence interval to determine the answer. (Round your answers to 3 decimal places, if needed.) ( 00) (d) Based on this one-sided confidence interval, does the sample data support this belief? No, since the interval is completely above 0.1. Yes, since the interval contains 0.1. Yes, since the interval is completely above 0.1. No, since the interval contains 0.1.
Step by Step Solution
There are 3 Steps involved in it

Get step-by-step solutions from verified subject matter experts