

Question: Hello, can you please help me with these equations: Times Interest Earned, RNOA, and ROCE for both 2019 and 2018? I also need to complete

Hello, can you please help me with these equations: Times Interest Earned, RNOA, and ROCE for both 2019 and 2018?
I also need to complete projected financial statements including income statements, balance sheets, and statements of cash flows (I believe for 2 years). The directions on this part state: make necessary adjustments for material non-recurring or unusual income or expenses as well as off-balance sheet assets or liabilities, among others as covered in the course. The adjustment will improve comparability and ensure accurate representation of the organization's' economic performance. Be sure to identify important assumptions regarding the companies, industry and business environment, and other important assumptions for estimates and forecasts, including their business strategies.
All information you should need is below. For the equations, if you could tell me what value (Excel cell) you are using, that would be great.
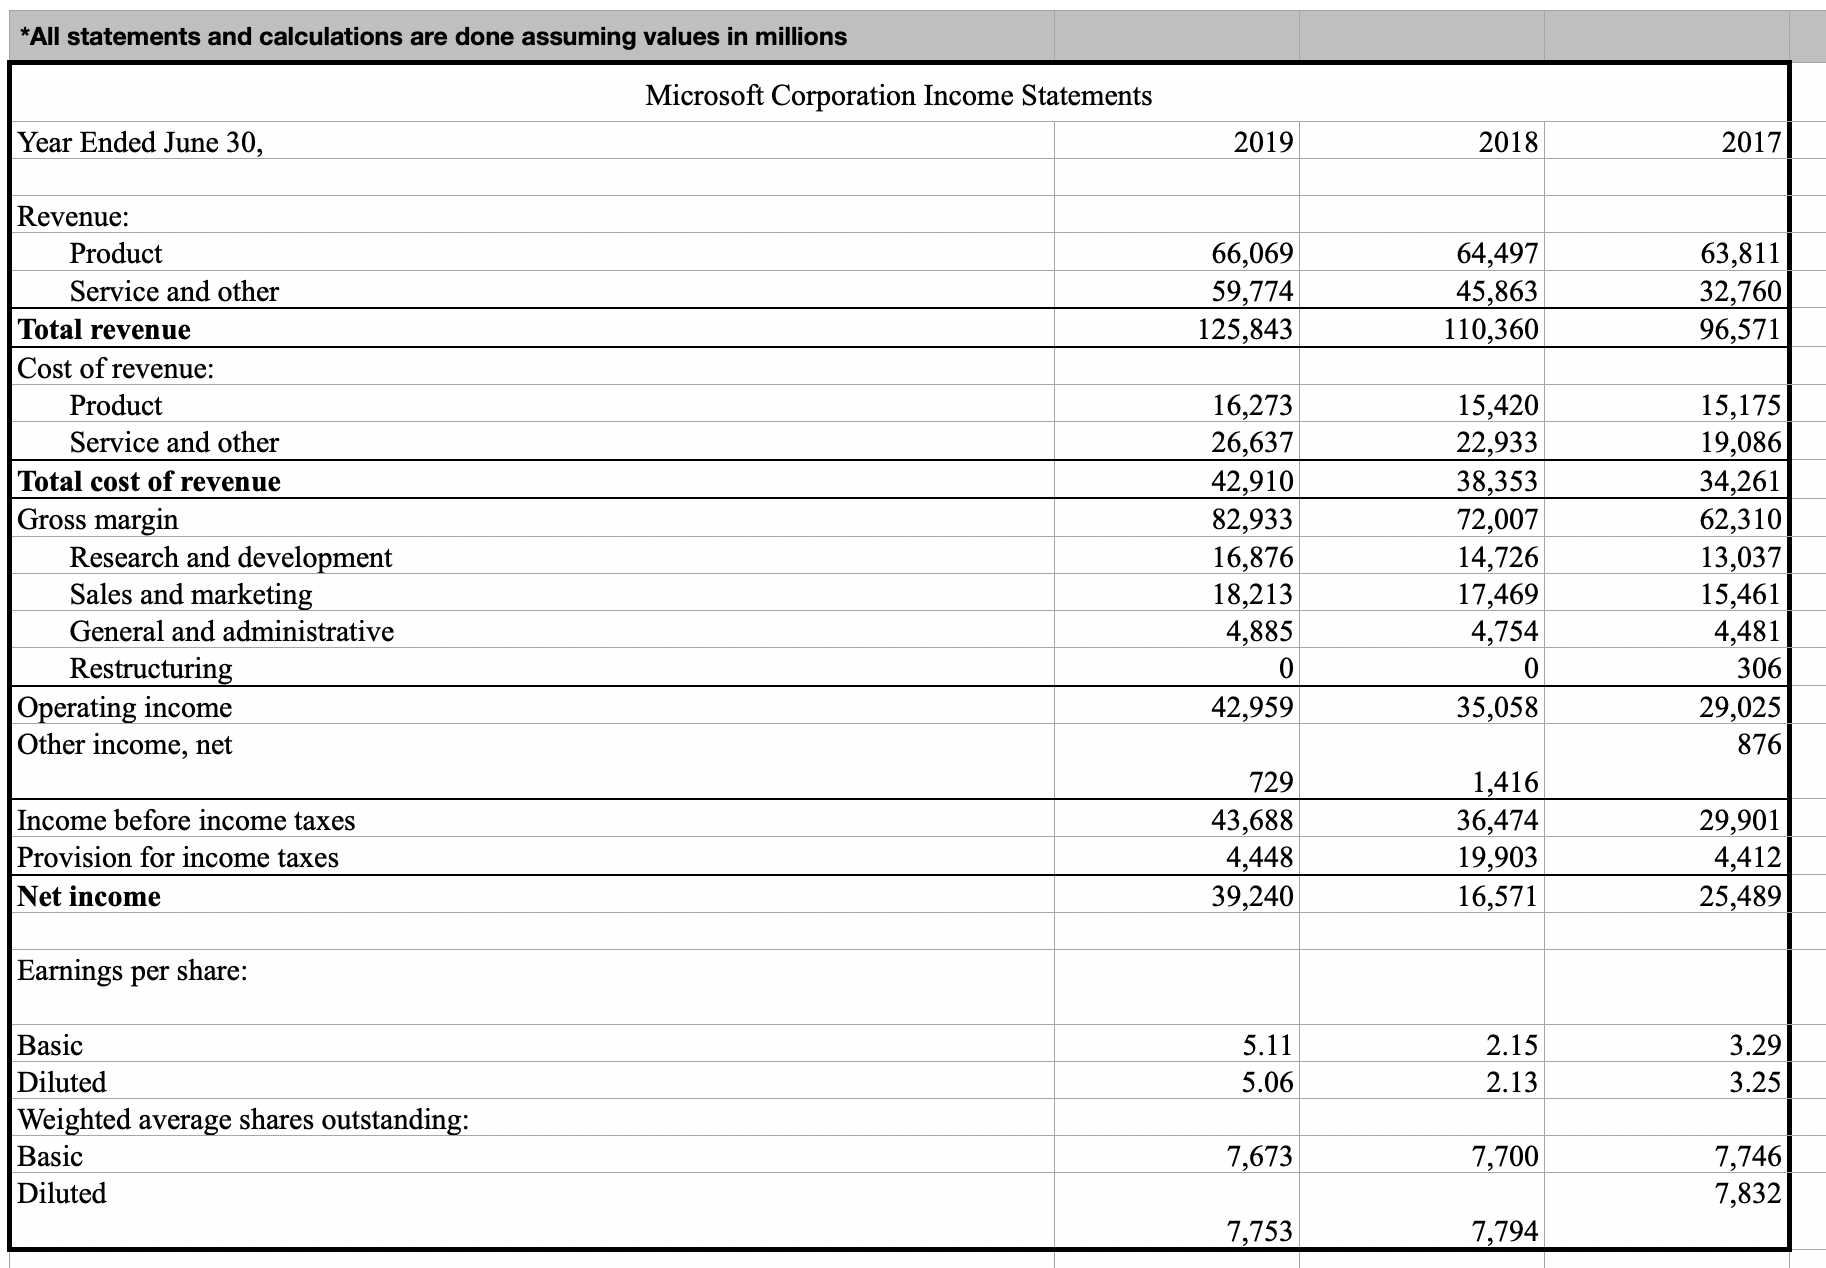
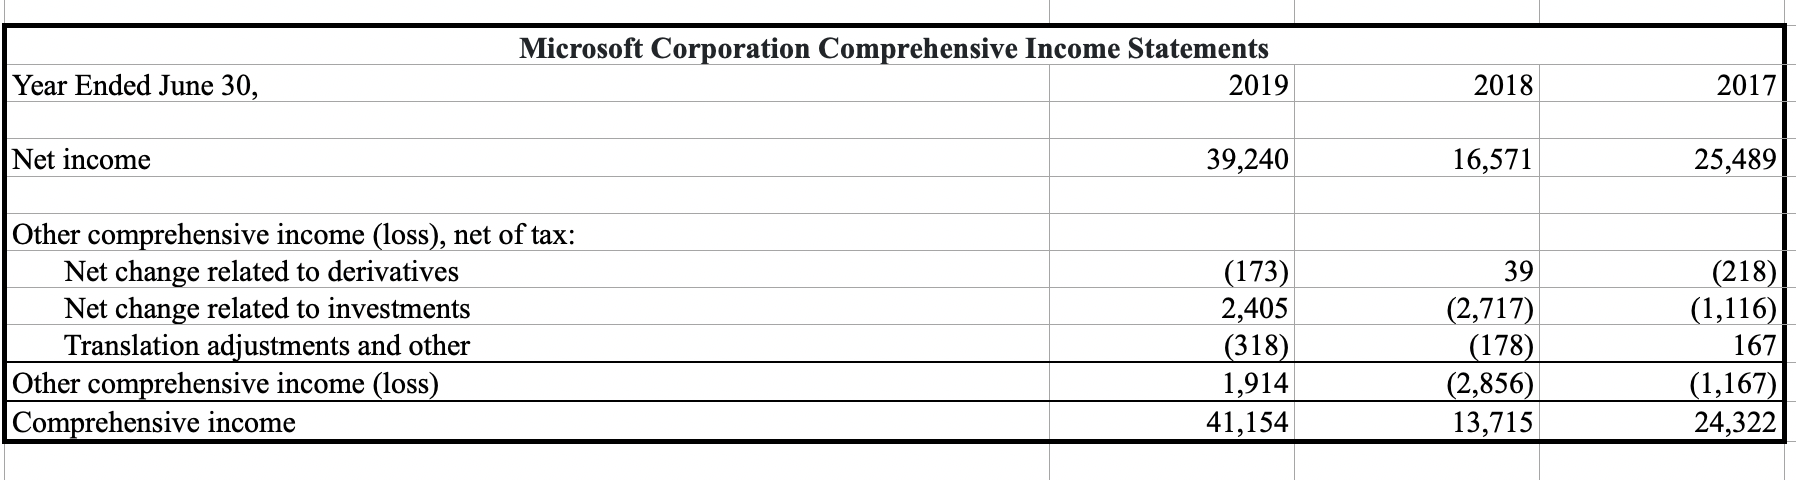
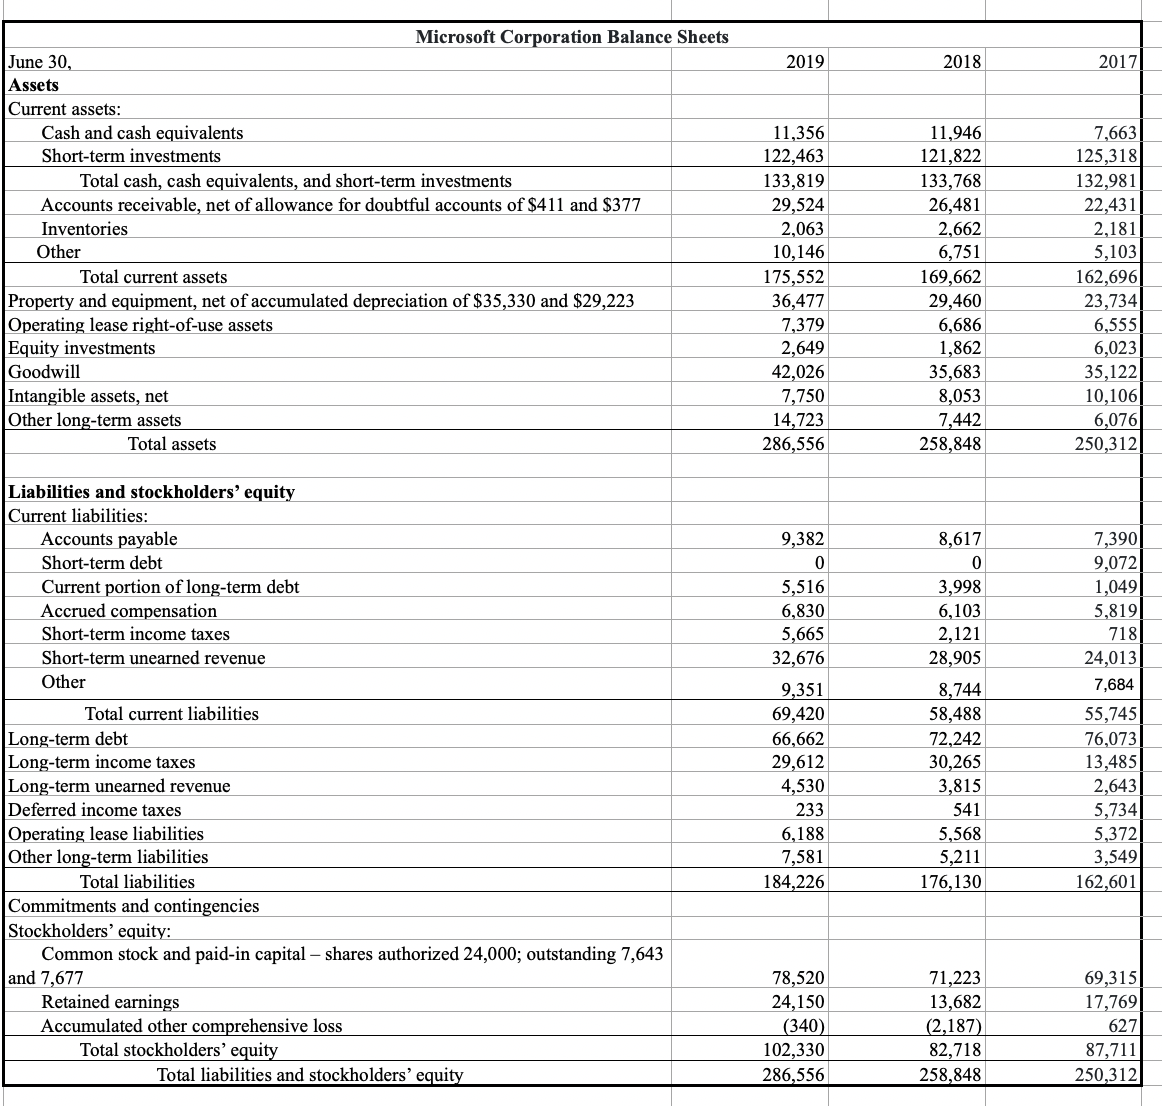


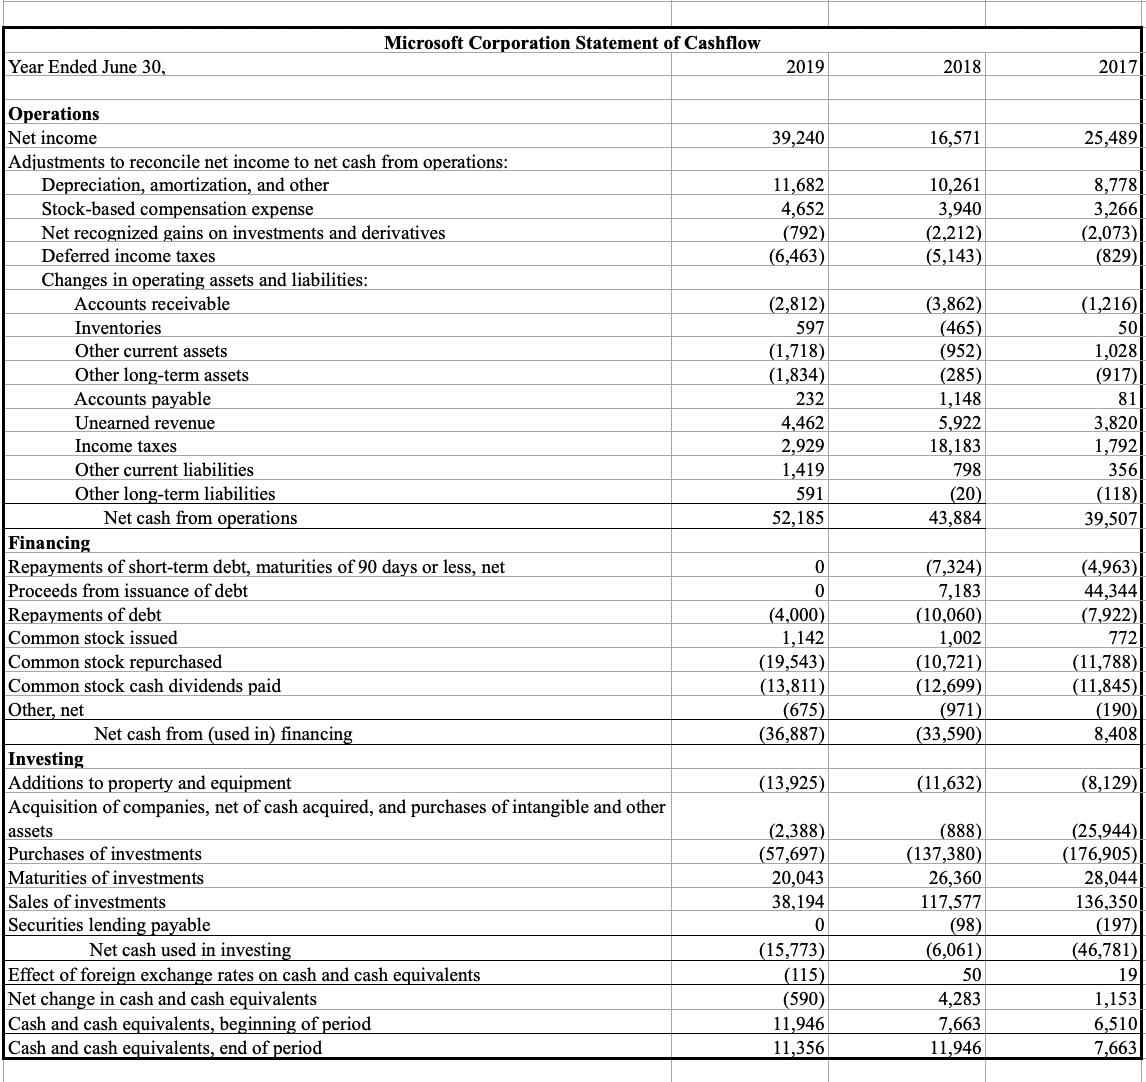
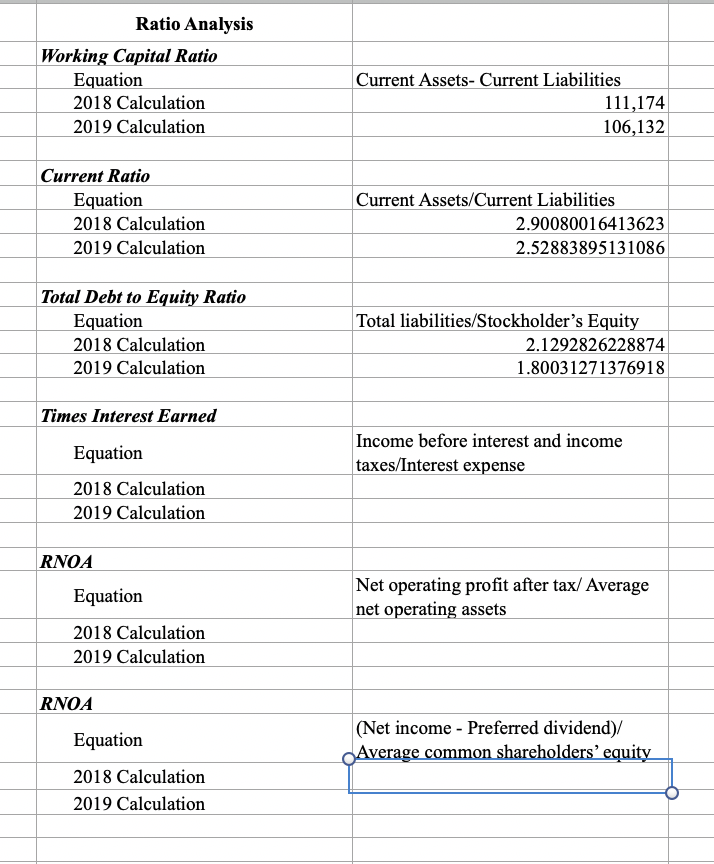
Microso Corporation Income Statements Year Ended June 30, Revenue: Pro duct 66,069 64,497 Service and other 59,774 45,863 Total revenue 125,843 110,360 Cost of revenue: Product 16,273 15,420 Service and other 26,637 22,933 Total cost of revenue Gross margin 42,910 38,353 Research and development Sales and marketing General and administrative Re structurin - Operating income Other income, net Income before income taxes Provision for income taxes Net income Earnings per share: Basic Diluted Weighted average shares outstanding: Basic Diluted Year Ended June 30, Microsoft Corporation Comprehensive Income Statements 2019 2018 2017 Net income 39,240 16,571 25,489 Other comprehensive income (loss), net of tax: Net change related to derivatives Net change related to investments (173) 39 (218) Translation adjustments and other 2,405 (2,717) (1,116) Other comprehensive income (loss) (318) (178) 167 Comprehensive income 1,914 (2,856) (1,167) 41,154 13,715 24,322Microsoft Corporation Balance Sheets June 30, 2019 2018 2017 Assets Current assets: Cash and cash equivalents 11,356 11,946 7,663 Short-term investments 122,463 121,822 125,318 Total cash, cash equivalents, and short-term investments 133,819 133,768 132,981 Accounts receivable, net of allowance for doubtful accounts of $411 and $377 29,524 26,481 22,431 Inventories 2,063 2,662 2,181 Other 10,146 6,751 5,103 Total current assets 175,552 169,662 162,696 Property and equipment, net of accumulated depreciation of $35,330 and $29,223 36,477 29.460 23,734 Operating lease right-of-use assets 7,379 6,686 6,555 Equity investments 2,649 1,862 6,023 Goodwill 42,026 35,683 35,122 Intangible assets, net 7,750 8,053 10,106 Other long-term assets 14,723 7,442 6,076 Total assets 286,556 258,848 250,312 Liabilities and stockholders' equity Current liabilities: Accounts payable 9,382 8,617 7,390 Short-term debt 0 9,072 Current portion of long-term debt 5,516 3,998 1,049 Accrued compensation 6.830 6.103 5.819 Short-term income taxes 5,665 2,121 718 Short-term unearned revenue 32,676 28,905 24,013 Other 9,351 8,744 7,68 Total current liabilities 69,420 58.488 55,745 Long-term debt 66,662 72,242 76,073 Long-term income taxes 29,612 30.265 13,485 Long-term unearned revenue 4,530 3,815 2,643 Deferred income taxes 233 541 5,734 Operating lease liabilities 6,188 5,568 Other long-term liabilities 5,372 7,581 5,211 3,549 Total liabilities 184,226 176,130 162,601 Commitments and contingencies Stockholders' equity: Common stock and paid-in capital - shares authorized 24,000; outstanding 7,643 and 7,677 78,520 71,223 69,315 Retained earnings 24,150 13.682 17,769 Accumulated other comprehensive loss (340 (2,187) 627 Total stockholders' equity 102,330 82,718 87,711 Total liabilities and stockholders' equity 286,556 258,848 250,312Microsoft Corporation Statement of Cashflow Year Ended June 30, 2019 2018 2017 Operations Net income 39,240 16,571 25,489 Adjustments to reconcile net income to net cash from operations: Depreciation, amortization, and other 11,682 10,261 8,778 Stock-based compensation expense 4,652 3,940 3,266 Net recognized gains on investments and derivatives (792 Deferred income taxes (2,212) (2,073 (6,463) (5,143) (829) Changes in operating assets and liabilities: Accounts receivable (2,812) 3,862) (1,216) Inventories 597 465) 50 Other current assets (1,718) (952) 1,028 Other long-term assets (1,834) (285) (917) Accounts payable 232 1,148 81 Unearned revenue 4,462 5,922 3,820 Income taxes 2,929 18 ,183 Other current liabilities 1,792 1,419 798 356 Other long-term liabilities 591 20) (118) Net cash from operations 52,185 43,884 39,507 Financing Repayments of short-term debt, maturities of 90 days or less, net Proceeds from issuance of debt 0 (7,324) (4,963 7,183 44,344 Repayments of debt (4,000) (10,060) Common stock issued (7,922) 1,142 1,002 772 Common stock repurchased (19,543) (10,721) (11,788) Common stock cash dividends paid (13,811) (12,699) (11,845) Other, net 675 971) (190) Net cash from (used in) financing (36,887) (33,590 8.408 Investing Additions to property and equipment (13,925) (11,632) (8,129) Acquisition of companies, net of cash acquired, and purchases of intangible and other assets (2,388) (888) (25,944) Purchases of investments (57,697) (137,380) (176,905 Maturities of investments 20,043 26,360 28,044 Sales of investments 38,194 117,577 136,350 Securities lending payable (98) (197 Net cash used in investing (15,773) (6,061) (46,781) Effect of foreign exchange rates on cash and cash equivalents 115 50 19 Net change in cash and cash equivalents '590 4,283 1,153 Cash and cash equivalents, beginning of period 11,946 7,663 6,510 Cash and cash equivalents, end of period 11,356 11,946 7,663Ratio Analysis Working Capital Ratio Equation Current Assets- Current Liabilities 2018 Calculation 111,174 2019 Calculation 106,132 Current Ratio Equation Current Assets/Current Liabilities 2018 Calculation 2.90080016413623 2019 Calculation 2.52883895131086 Total Debt to Equity Ratio Equation Total liabilities/Stockholder's Equity 2018 Calculation 2.1292826228874 2019 Calculation 1.80031271376918 Times Interest Earned Equation Income before interest and income taxes/Interest expense 2018 Calculation 2019 Calculation RNOA Equation Net operating profit after tax/ Average net operating assets 2018 Calculation 2019 Calculation RNOA Equation (Net income - Preferred dividend)/ Average common shareholders' equity 2018 Calculation 2019 Calculation
Step by Step Solution
There are 3 Steps involved in it

Get step-by-step solutions from verified subject matter experts