

Question: Hello! I am having trouble interpreting these graphs can someone please help me. When explaining the graphs please do not simplify write the definition. Can
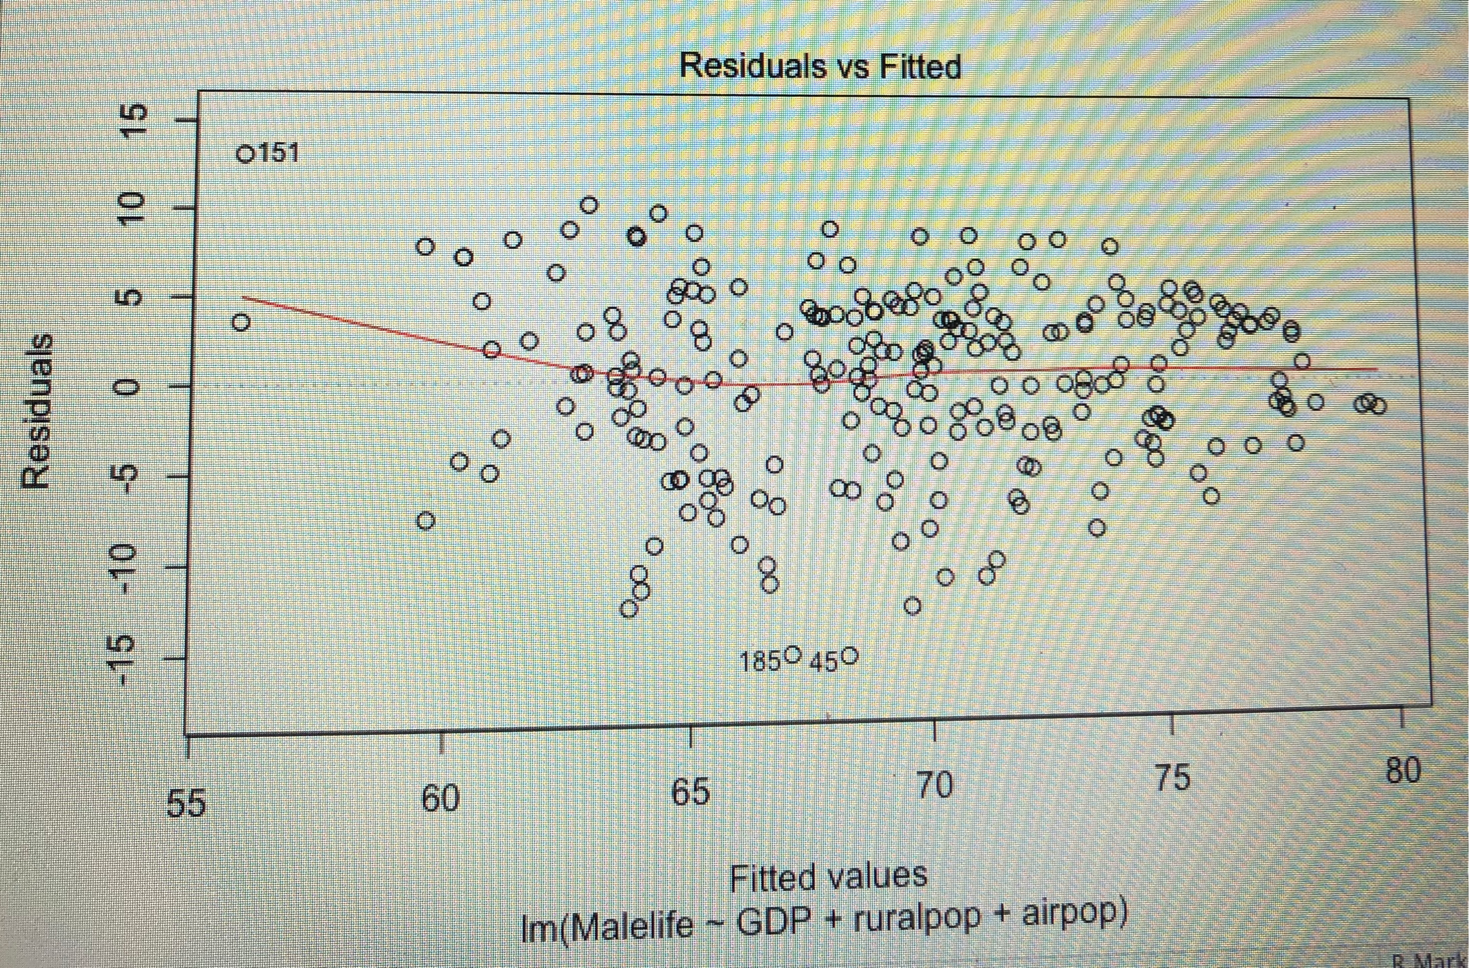
Hello! I am having trouble interpreting these graphs can someone please help me. When explaining the graphs please do not simplify write the definition. Can you explain what you notice from the graphs or the errors that are presented in the graph. Thank you!


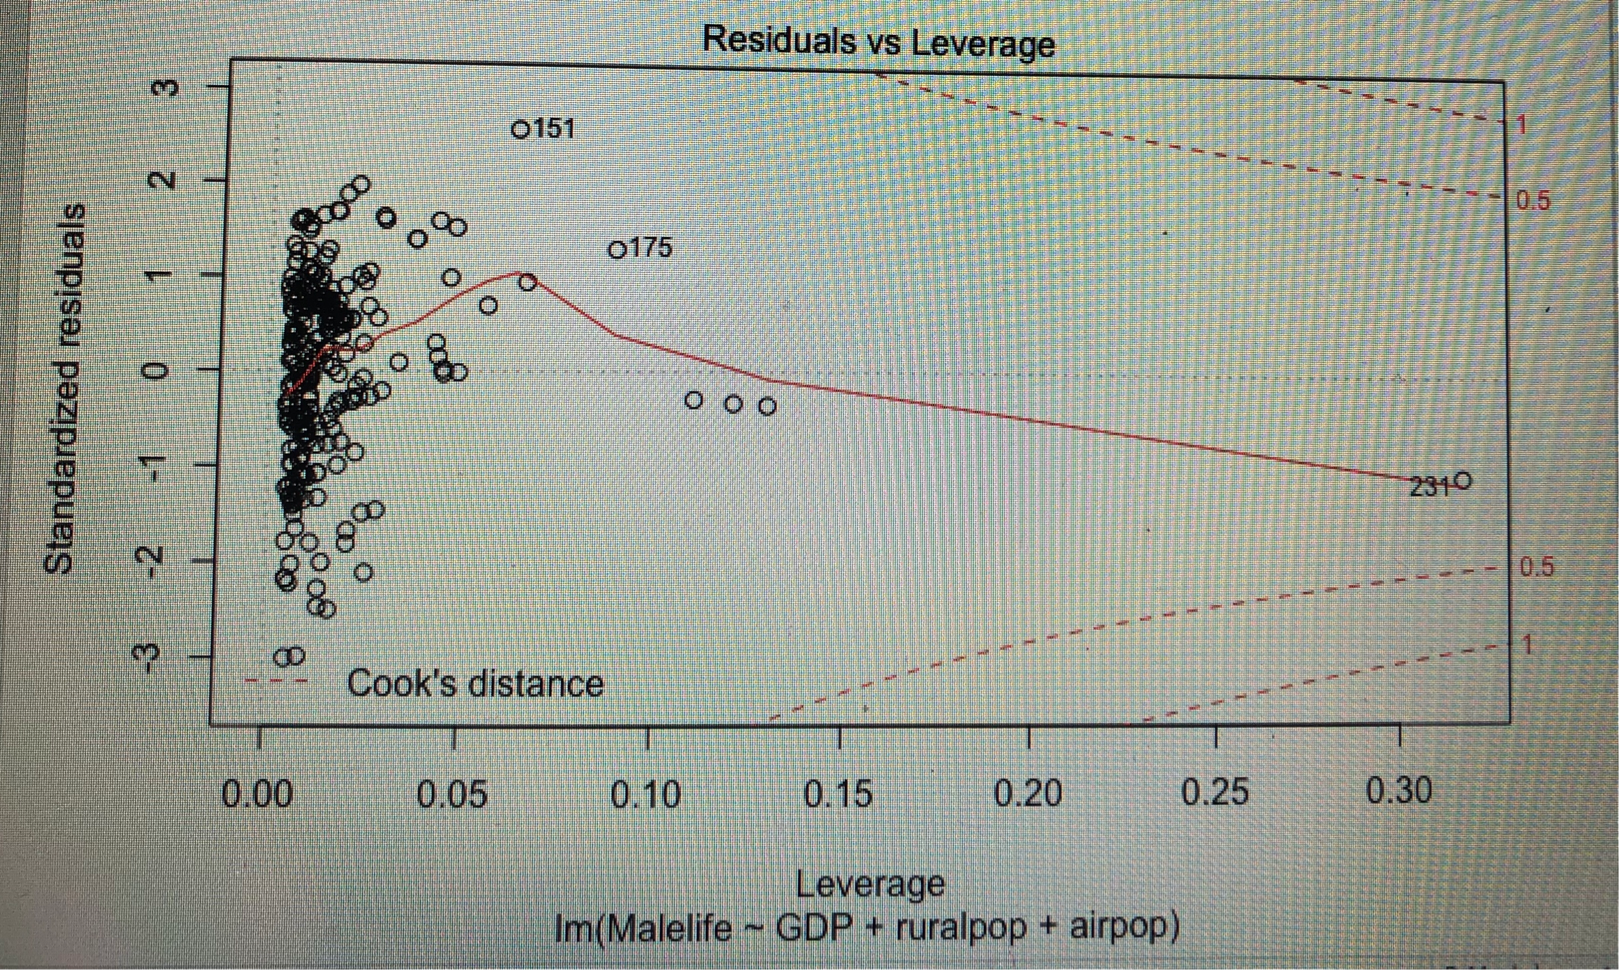
\f\f\fResiduals vs Leverage 0151 Standardized residuals O 0.5 0175 O C 58 O O DO D 8 2310 O 0.5 Cook's distance 0.00 0.05 0.10 0.15 0.20 0.25 0.30 Leverage Im(Malelife - GDP + ruralpop + airpop)
Step by Step Solution
There are 3 Steps involved in it
1 Expert Approved Answer
Step: 1 Unlock

Question Has Been Solved by an Expert!
Get step-by-step solutions from verified subject matter experts
Step: 2 Unlock
Step: 3 Unlock