

Question: Hello I have an economics math graphing based question, I am trying to figure out where to plot the blue line (circle symbols) to plot
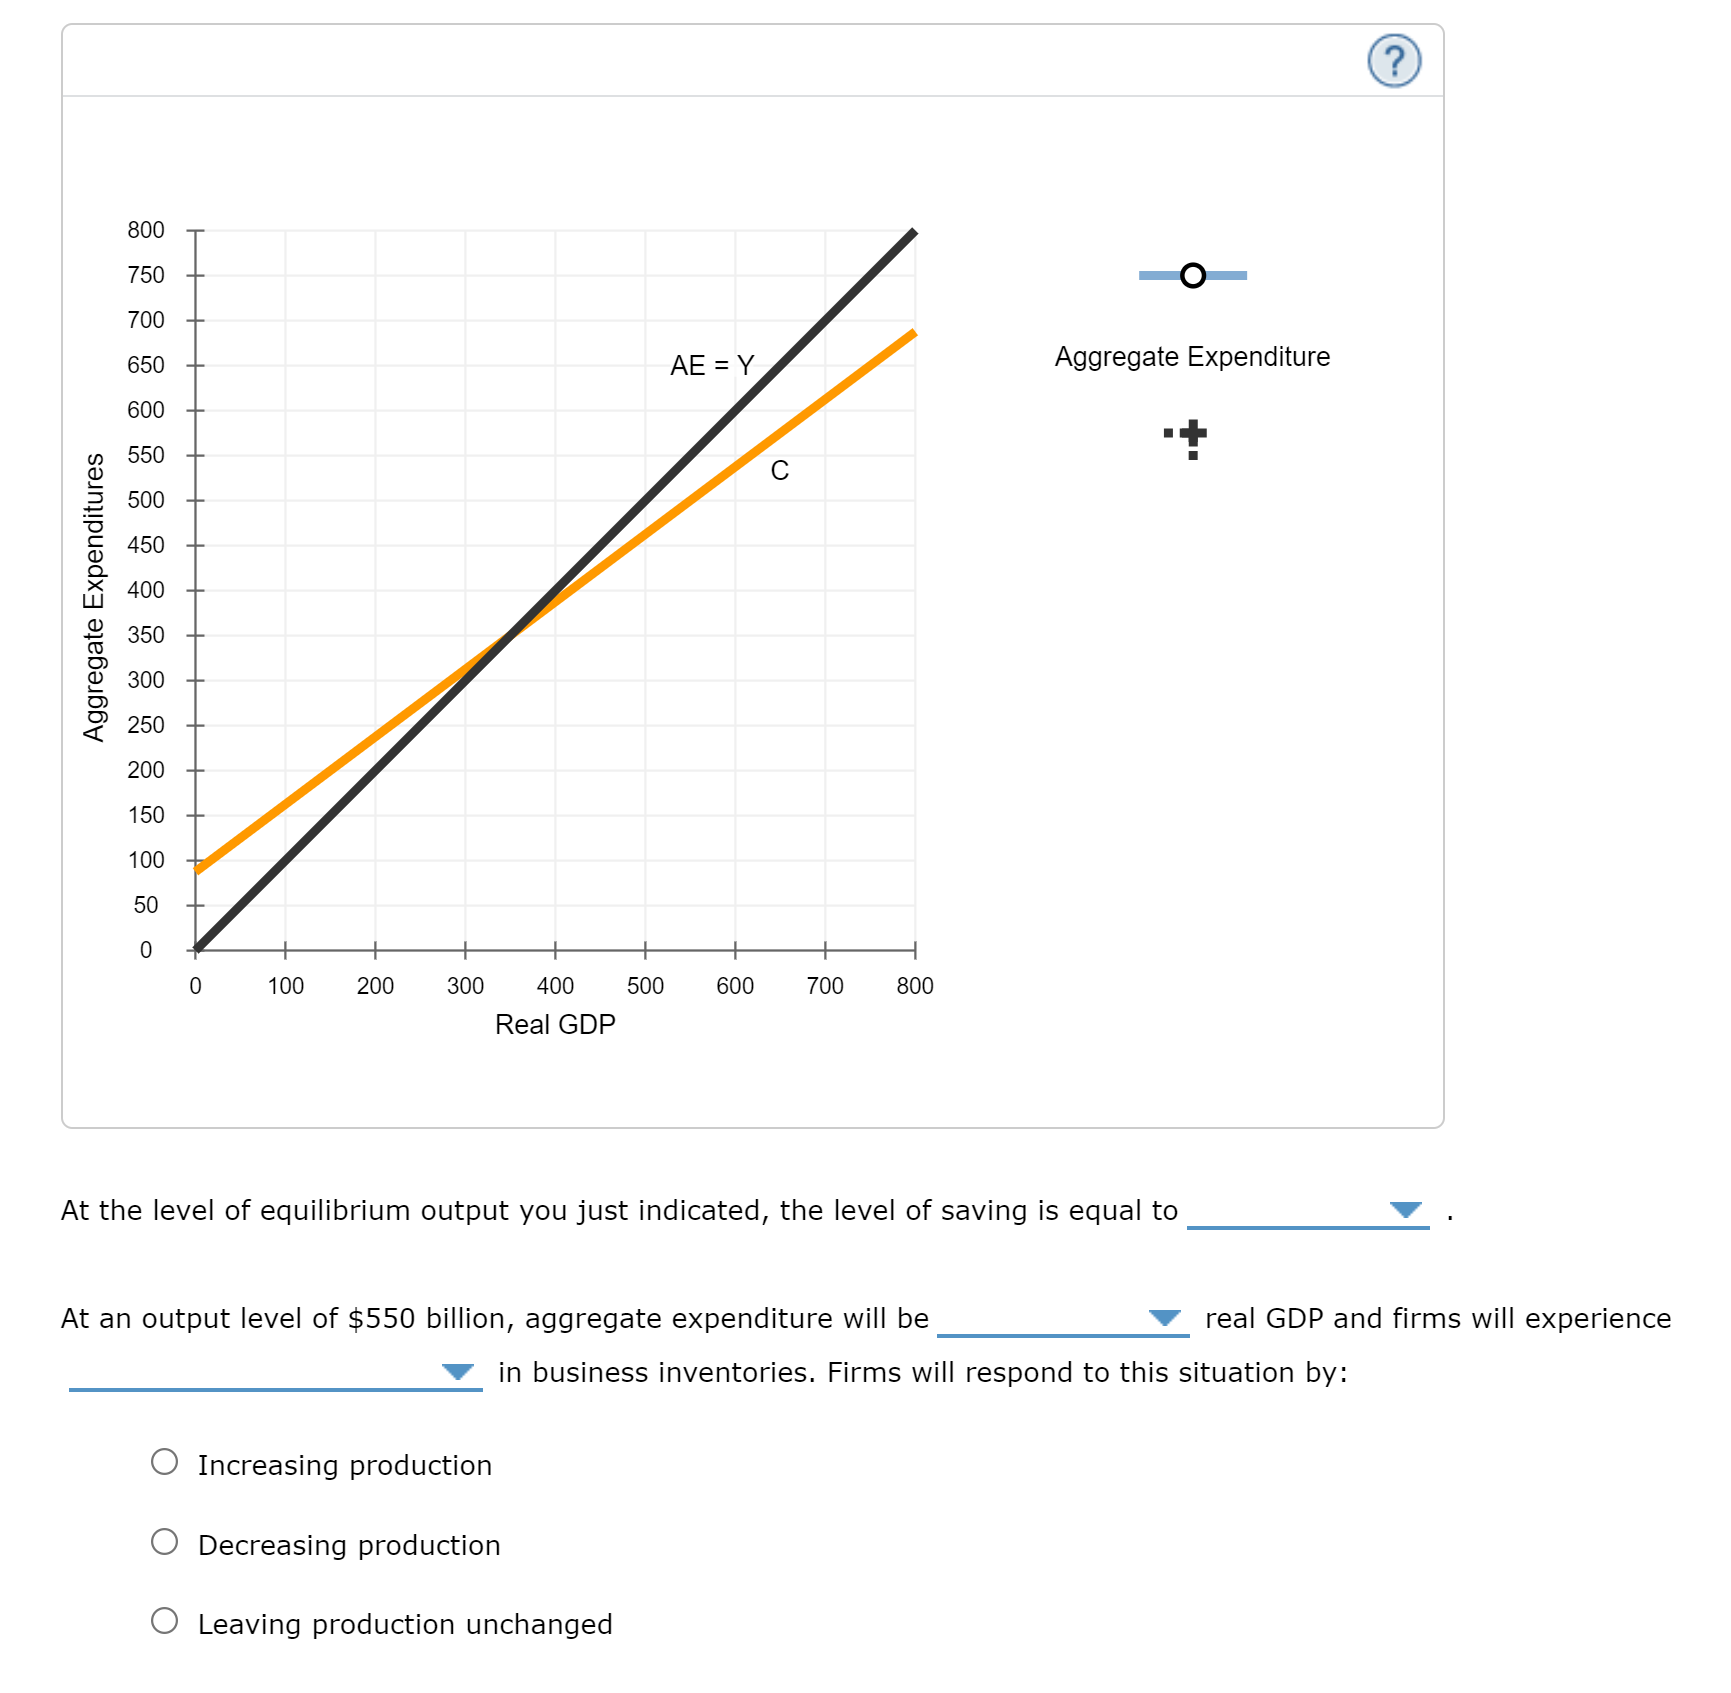
Hello I have an economics math graphing based question, I am trying to figure out where to plot the blue line (circle symbols) to plot this economy's initial aggregate expenditure line, (C + I). Then, use the black point (X symbol) to indicate this economy's initial equilibrium output. Also, At the level of equilibrium output you just indicated, the level of saving is equal to (100 billion, or 200 billion, or 25 billion, or 50 billion?) At an output level of $550 billion, aggregate expenditure will be (greater than, or less than, or equal to?) real GDP and firms will experience (an unplanned increase or an unplanned decrease or no change?) in business inventories. Firms will respond to this situation by (Increasing Production or Leaving Production unchanged or Decreasing Production?)
Here are the images of the question below (:
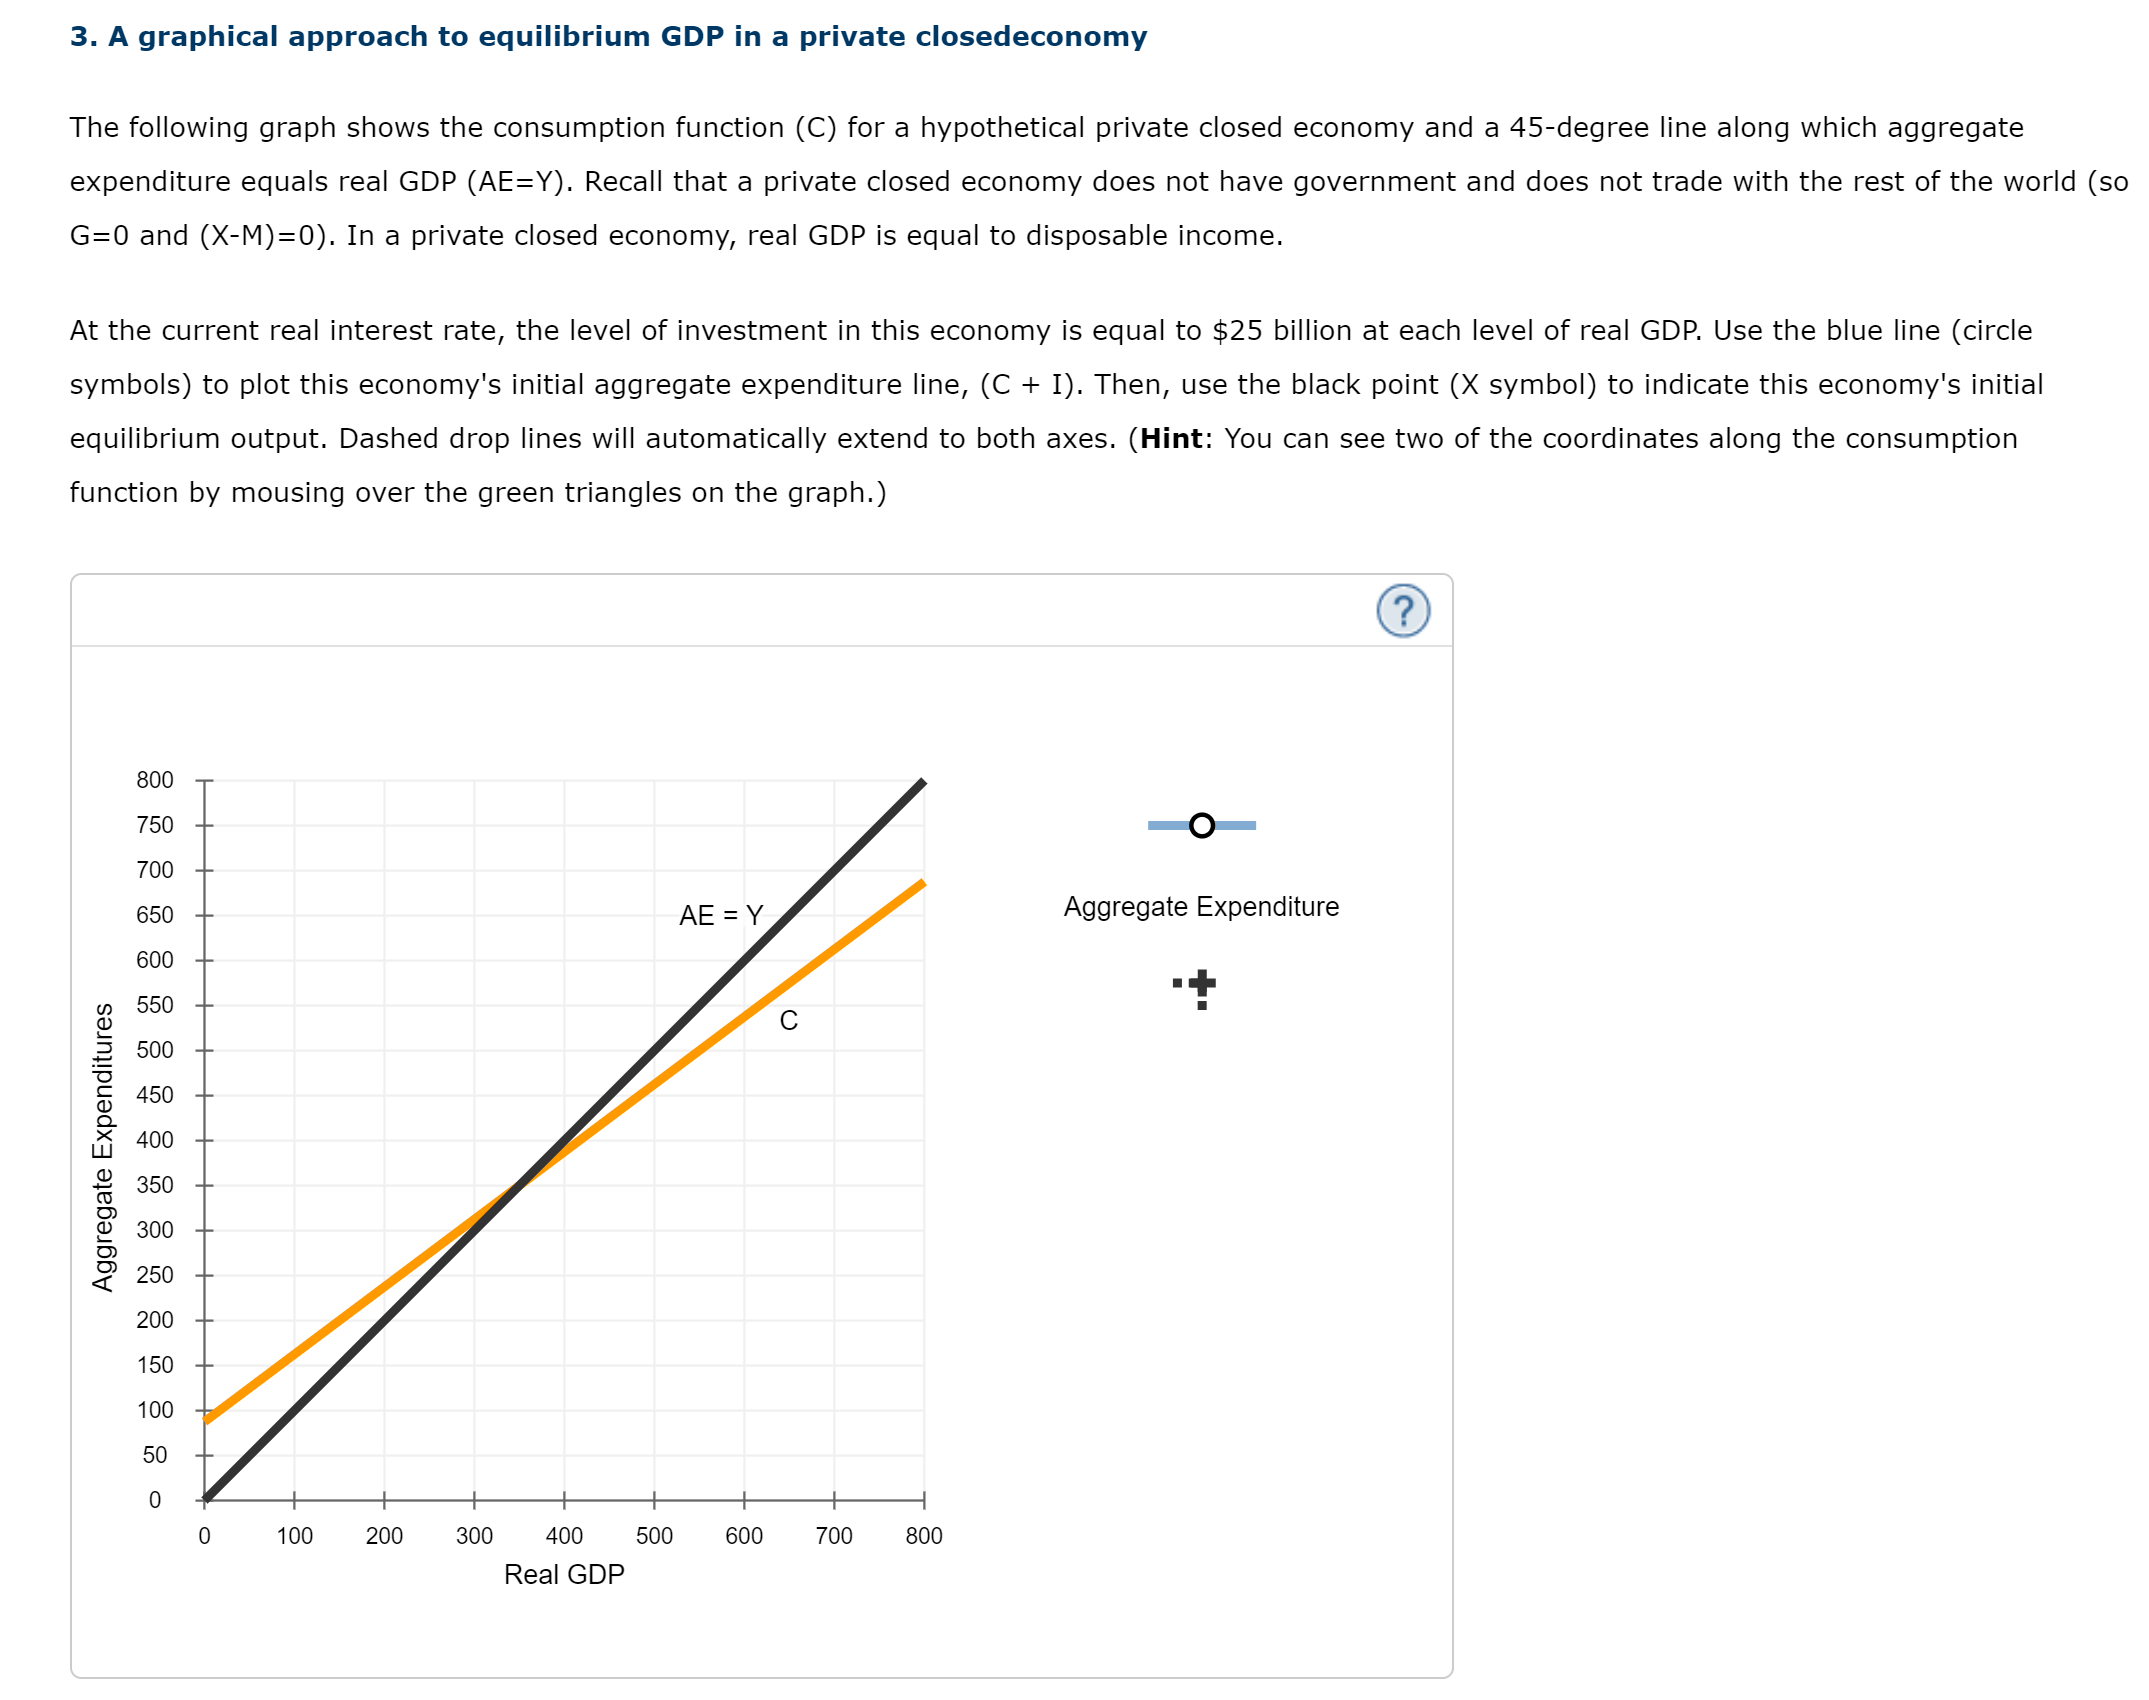
3. A graphical approach to equilibrium GDP in a private closedeconomy The following graph shows the consumption function (C) for a hypothetical private closed economy and a 45degree line along which aggregate expenditure equals real GDP (AE=Y). Recall that a private closed economy does not have government and does not trade with the rest of the world (so 6:0 and (XM)=0). In a private closed economy, real GDP is equal to disposable income. At the current real interest rate, the level of investment in this economy is equal to $25 billion at each level of real GDP. Use the blue line (circle symbols) to plot this economy's initial aggregate expenditure line, (C + I). Then, use the black point (X symbol) to indicate this economy's initial equilibrium output. Dashed drop lines will automatically extend to both axes. (Hint: You can see two of the coordinates along the consumption function by mousing over the green triangles on the graph.) G) 800 750 _o_ 700 650 AE 600 550 500 450 400 350 300 250 200 Aggregate Expenditure H -
Step by Step Solution
There are 3 Steps involved in it

Get step-by-step solutions from verified subject matter experts