

Question: Hello, I've been trying to finish this bone stop for 2 days and I'm about to run out of time. I would appreciate any help
Hello, I've been trying to finish this bone stop for 2 days and I'm about to run out of time. I would appreciate any help or advice to finish this. I made the diagram to represent the variables and I'm not 100 percent sure that I did it right but I don't know how to go about the mean difference. I'm supposed use hypothetical data (ie: just make up some numbers) and then create a scatter plot to represent the data to identify the regression line to put into an equation. I would be so grateful for any kind of help
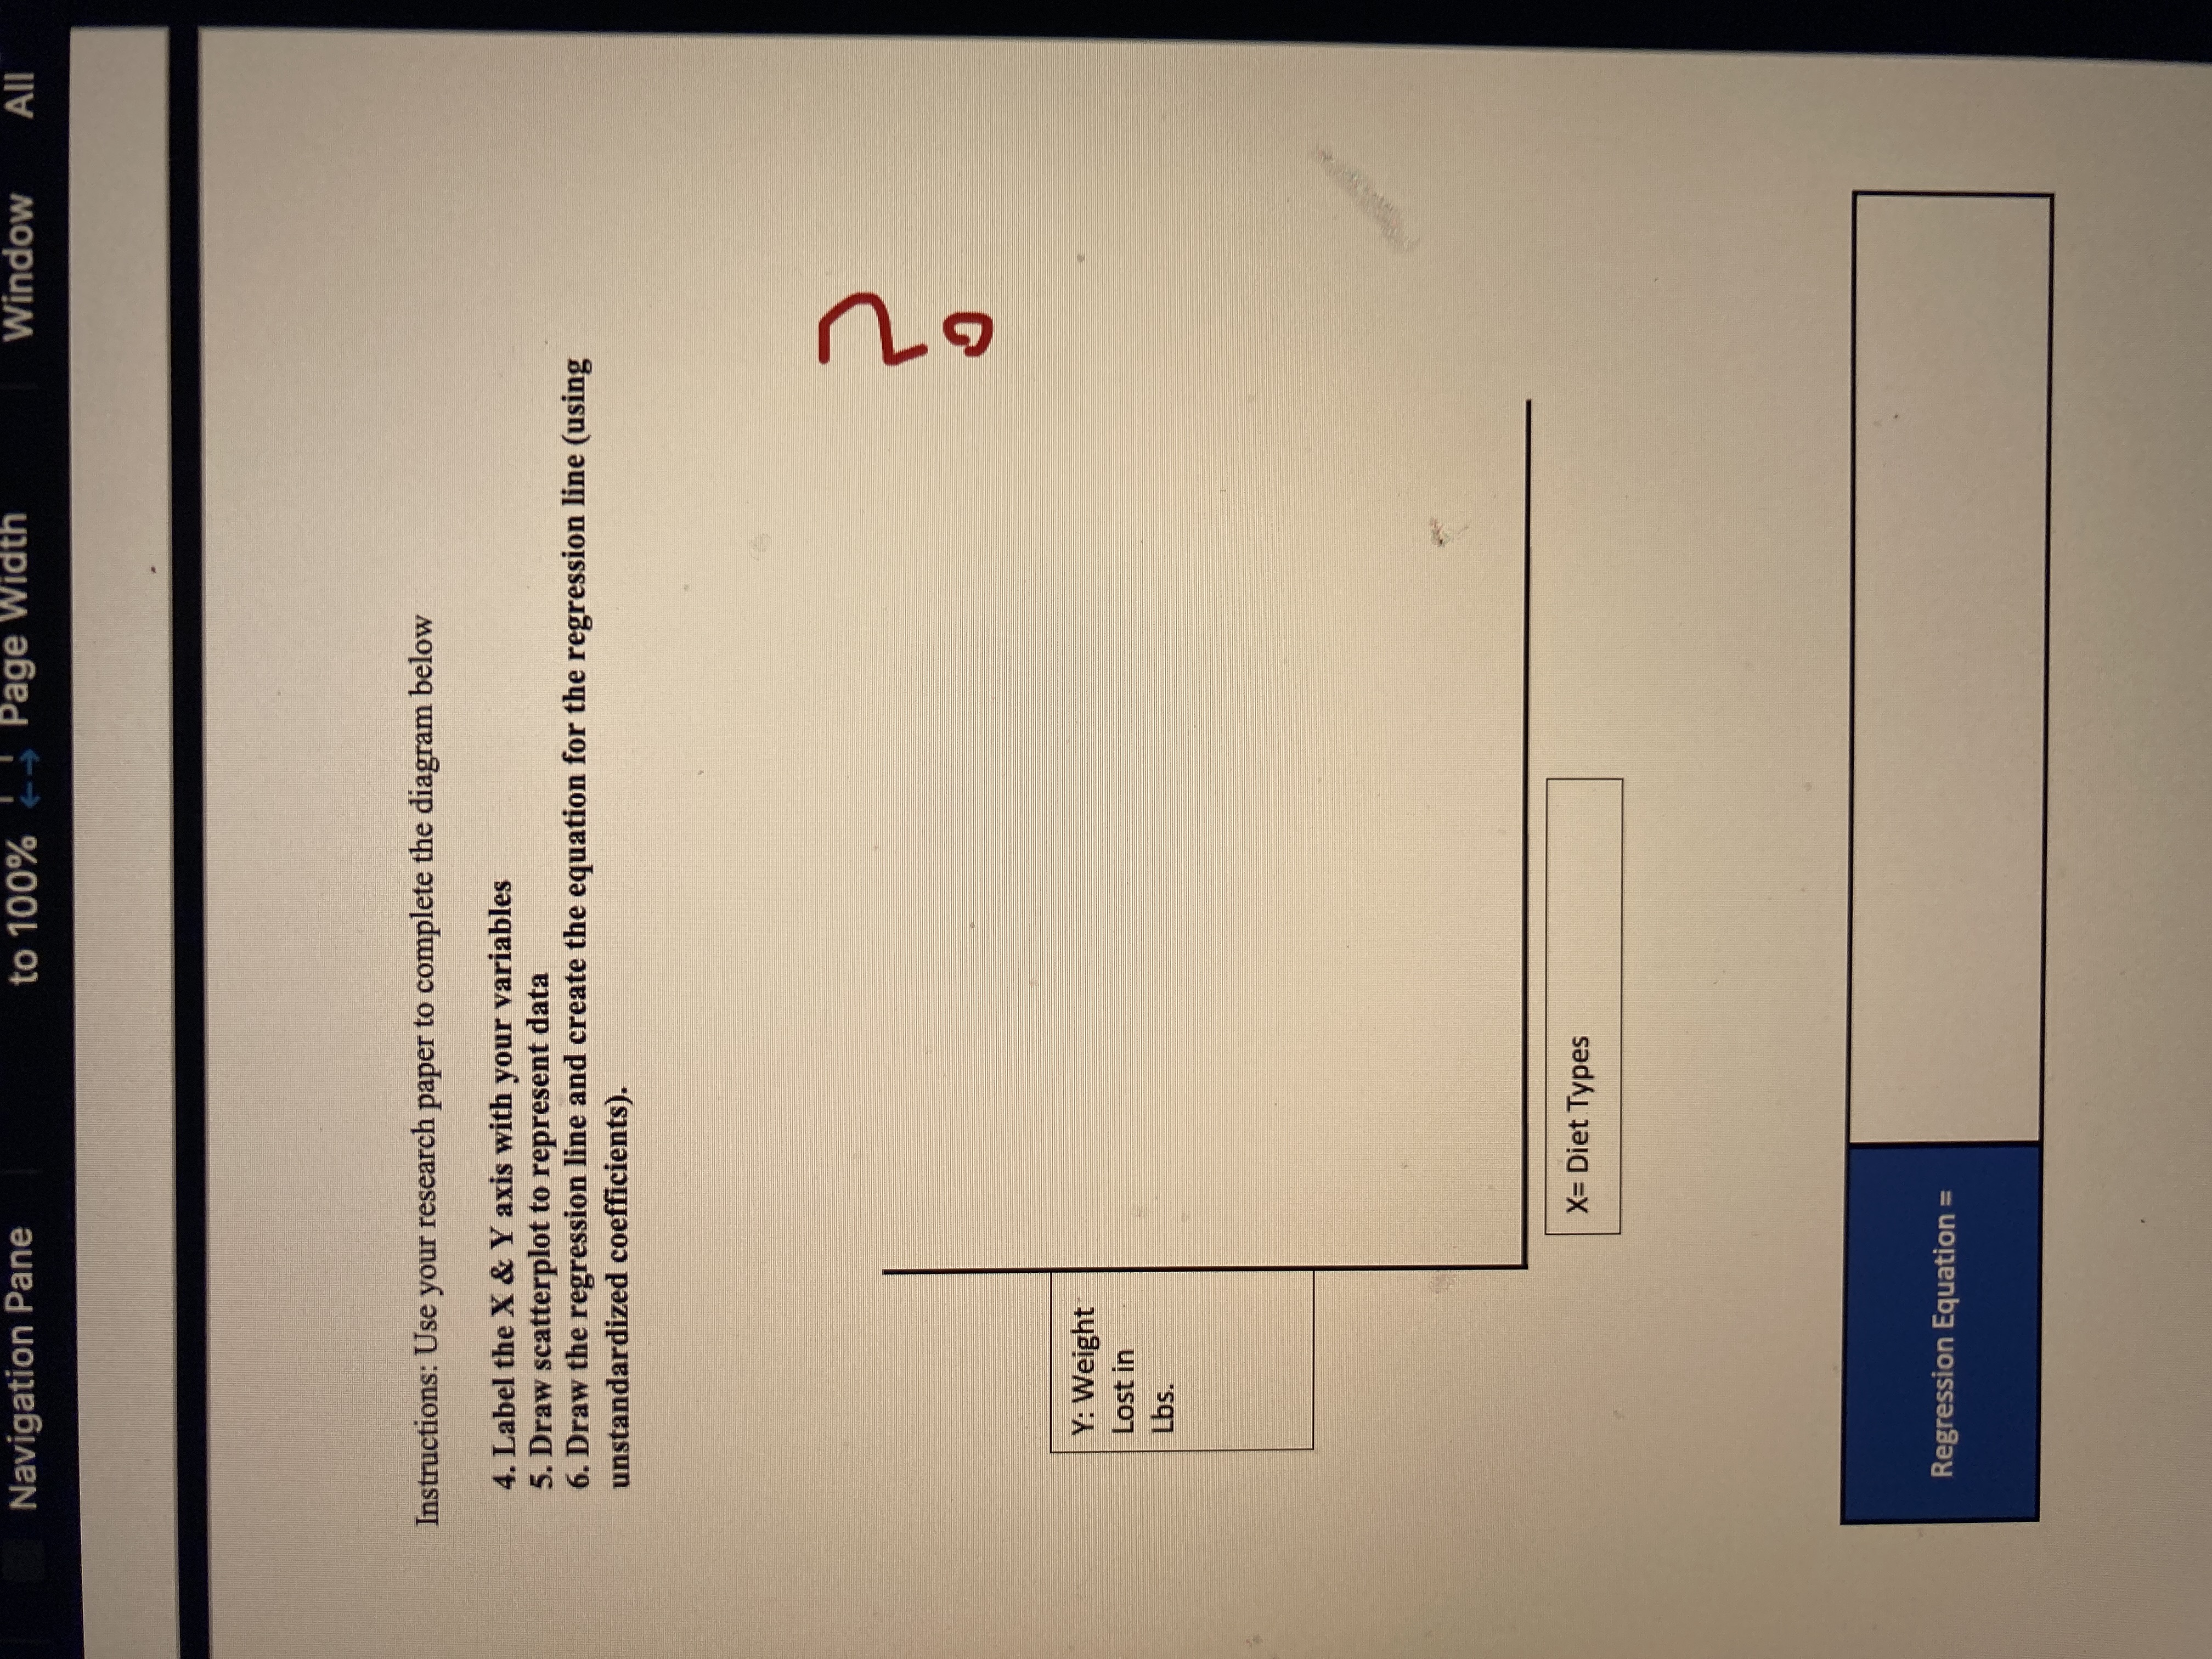
Navigation Pane to 100% Page Width Window All Instructions: Use your research paper to complete the diagram below 4. Label the X & Y axis with your variables 5. Draw scatterplot to represent data 6. Draw the regression line and create the equation for the regression line (using unstandardized coefficients). Y: Weight Lost in Lbs. X= Diet Types Regression Equation =
Step by Step Solution
There are 3 Steps involved in it

Get step-by-step solutions from verified subject matter experts