

Question: Hello please help me to answer this thank you! I need this asap. Please provide correct answer thank you! If there is an existing outlier,
Hello please help me to answer this thank you!
I need this asap.
Please provide correct answer thank you!
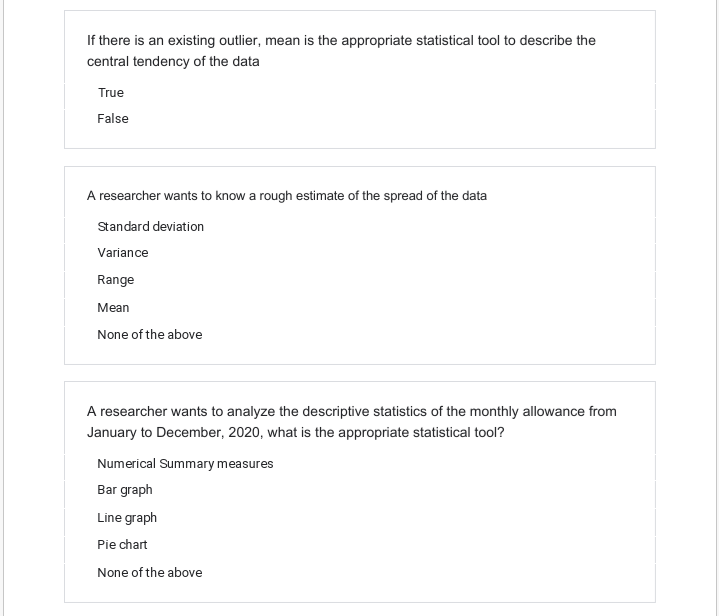
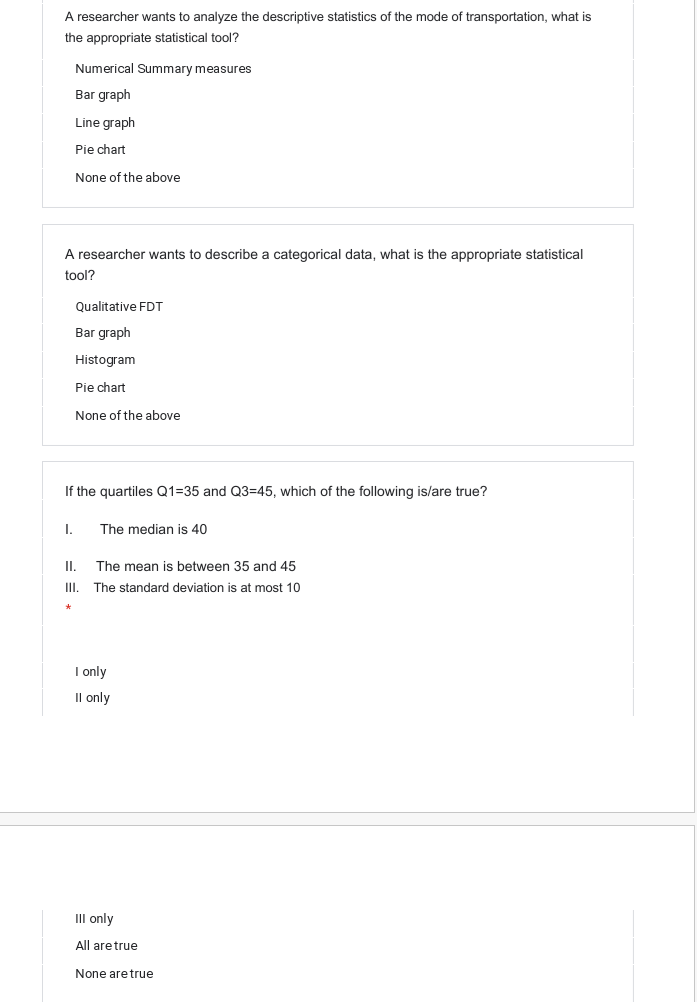
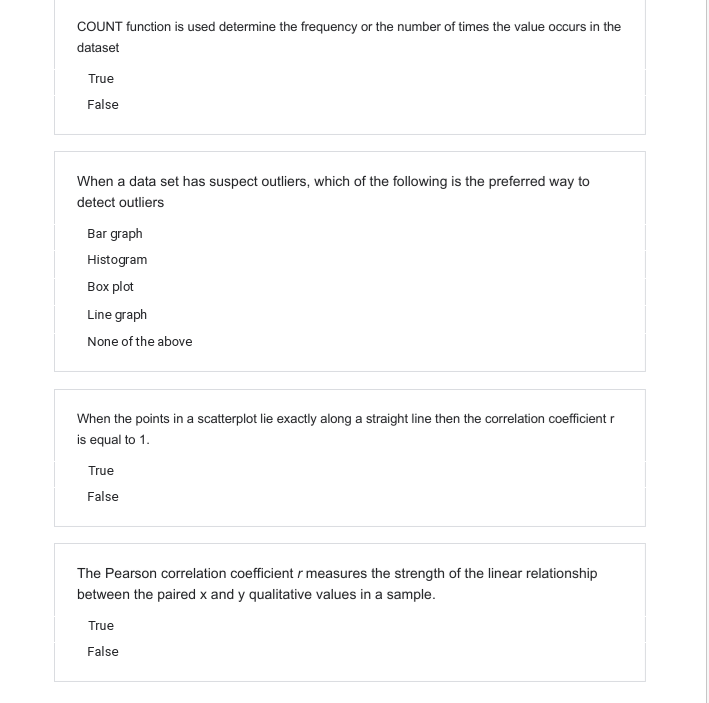
If there is an existing outlier, mean is the appropriate statistical tool to describe the central tendency of the data True False A researcher wants to know a rough estimate of the spread of the data Standard deviation Variance Range Mean None of the above A researcher wants to analyze the descriptive statistics of the monthly allowance from January to December, 2020, what is the appropriate statistical tool? Numerical Summary measures Bar graph Line graph Pie chart None of the aboveA researcher wants to analyze the descriptive statistics of the mode of transportation, what is the appropriate statistical tool? Numerical Summary measures Bar graph Line graph Pie chart None of the above A researcher wants to describe a categorical data, what is the appropriate statistical tool? Qualitative FDT Bar graph Histogram Pie chart None of the above If the quartiles Q1=35 and Q3=45, which of the following is/are true? 1. The median is 40 . The mean is between 35 and 45 The standard deviation is at most 10 I only Il only Ill only All are true None are trueCOUNT function is used determine the frequency or the number of times the value occurs in the dataset True False When a data set has suspect outliers, which of the following is the preferred way to detect outliers Bar graph Histogram Box plot Line graph None of the above When the points in a scatterplot lie exactly along a straight line then the correlation coefficient r is equal to 1. True False The Pearson correlation coefficient / measures the strength of the linear relationship between the paired x and y qualitative values in a sample. True False
Step by Step Solution
There are 3 Steps involved in it

Get step-by-step solutions from verified subject matter experts