

Question: Hello, TEAM! fProcess Capability Sixpack Report for WAITING TIME (POSTLEAN) Process Capability Sixpack Report for WAITING TIME (POSTLEAN) Test Results for I Chart of WAITING
Hello, TEAM!
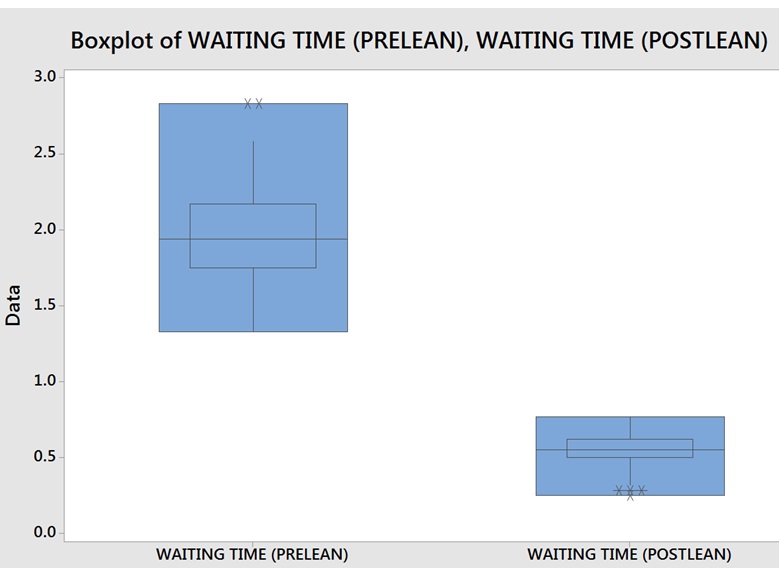
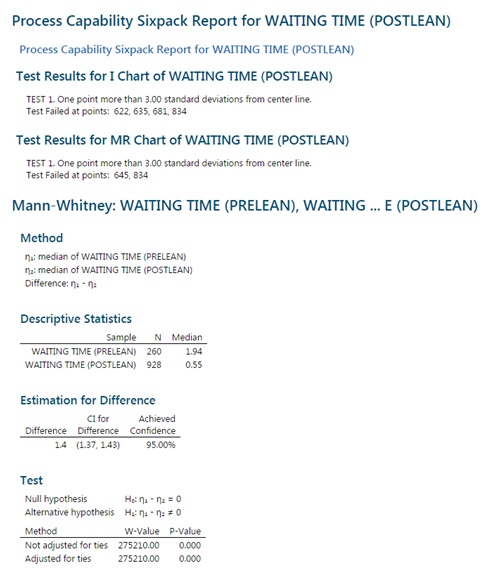
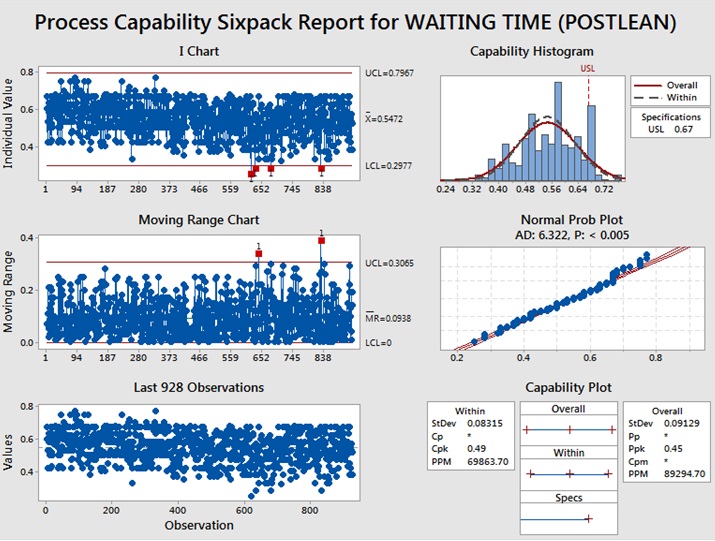

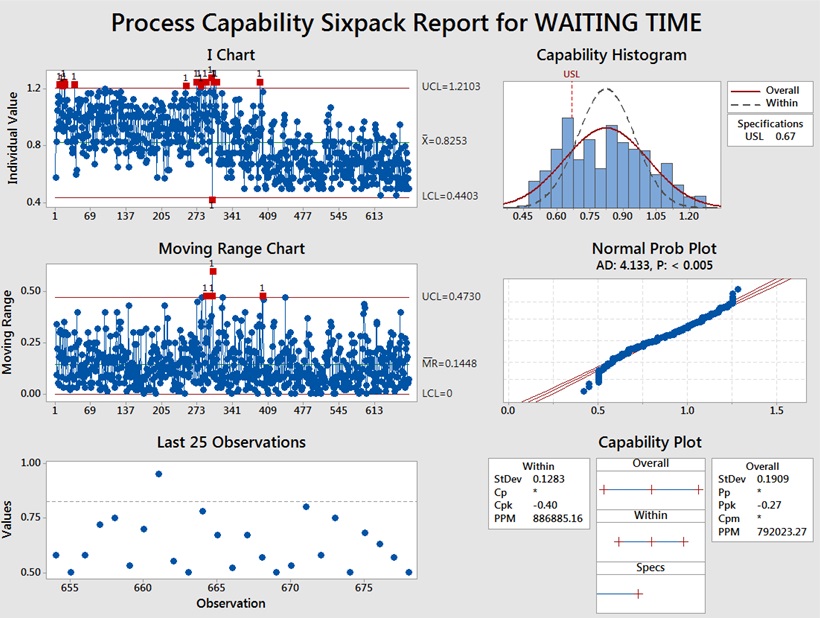
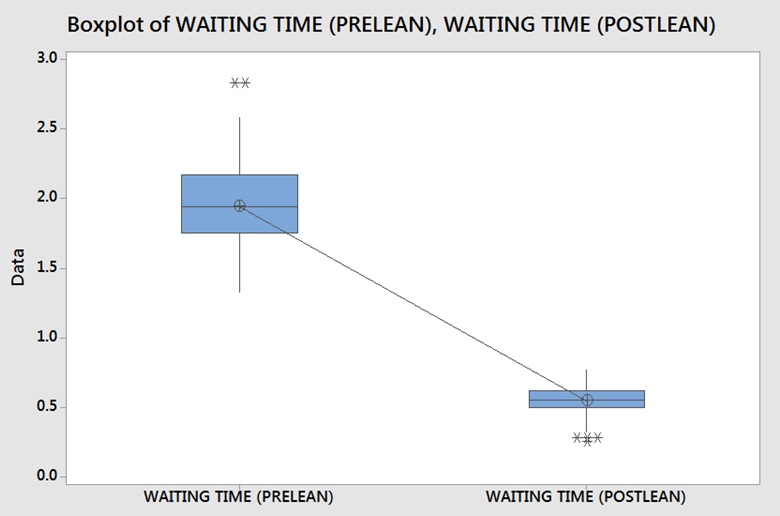
\fProcess Capability Sixpack Report for WAITING TIME (POSTLEAN) Process Capability Sixpack Report for WAITING TIME (POSTLEAN) Test Results for I Chart of WAITING TIME (POSTLEAN) TEST 1. One point more than 3.00 standard deviations from center line. Test Failed at points: 622, 635, 681, 834 Test Results for MR Chart of WAITING TIME (POSTLEAN) TEST 1. One point more than 3.00 standard deviations from center line. Test Failed at points: 645, 834 Mann-Whitney: WAITING TIME (PRELEAN), WAITING ... E (POSTLEAN) Method nai median of WAITING TIME (PRELEAN) nat median of WAITING TIME (POSTLEAN) Difference: no - n: Descriptive Statistics Sample N Median WAITING TIME (PRELEAN) 260 1.94 WAITING TIME (POSTLEAN) 928 0.55 Estimation for Difference CI for Achieved Difference Difference Confidence 14 (1.37, 1.43] 95.009% Test Null hypothesis Alternative hypothesis Hon - n: = 0 Method W-Value P-Value Not adjusted for ties 275210.00 0.000 Adjusted for ties 275210.00 0.000Process Capability Sixpack Report for WAITING TIME (POSTLEAN) I Chart Capability Histogram UCL=0.7967 USL Individual Value Overall . Within 0.6 X=05472 Specifications USL 0.67 0.4 LCL=0.2977 1 94 187 280 373 466 559 652 745 838 0.24 0.32 0.40 0.48 0.56 0.64 0.72 Moving Range Chart Normal Prob Plot 0.4 AD: 6.322, P:
Step by Step Solution
There are 3 Steps involved in it

Get step-by-step solutions from verified subject matter experts