

Question: Please show work for understanding to answer thank u EXTENDED ANALYSIS A1 AA 8-3 Comparative figures for Samsung, Apple, and Google follow. Samsung Apple Google
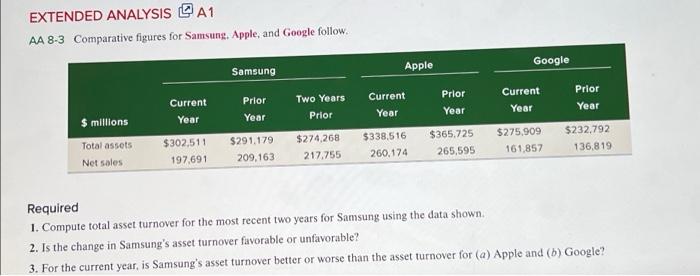
EXTENDED ANALYSIS A1 AA 8-3 Comparative figures for Samsung, Apple, and Google follow. Samsung Apple Google Prior Prior Current Year Two Years Prior Current Year Current Year Prior Year Year $ millions Year $302.511 197,691 $291,179 209.163 Total assets Net sales $274,268 217.755 $338,516 260.174 $365,725 265,595 $275,909 161,857 $232.792 136,819 Required 1. Compute total asset turnover for the most recent two years for Samsung using the data shown 2. Is the change in Samsung's asset turnover favorable or unfavorable? 3. For the current year, is Samsung's asset turnover better or worse than the asset turnover for (a) Apple and (b) Google
Step by Step Solution
There are 3 Steps involved in it

Get step-by-step solutions from verified subject matter experts