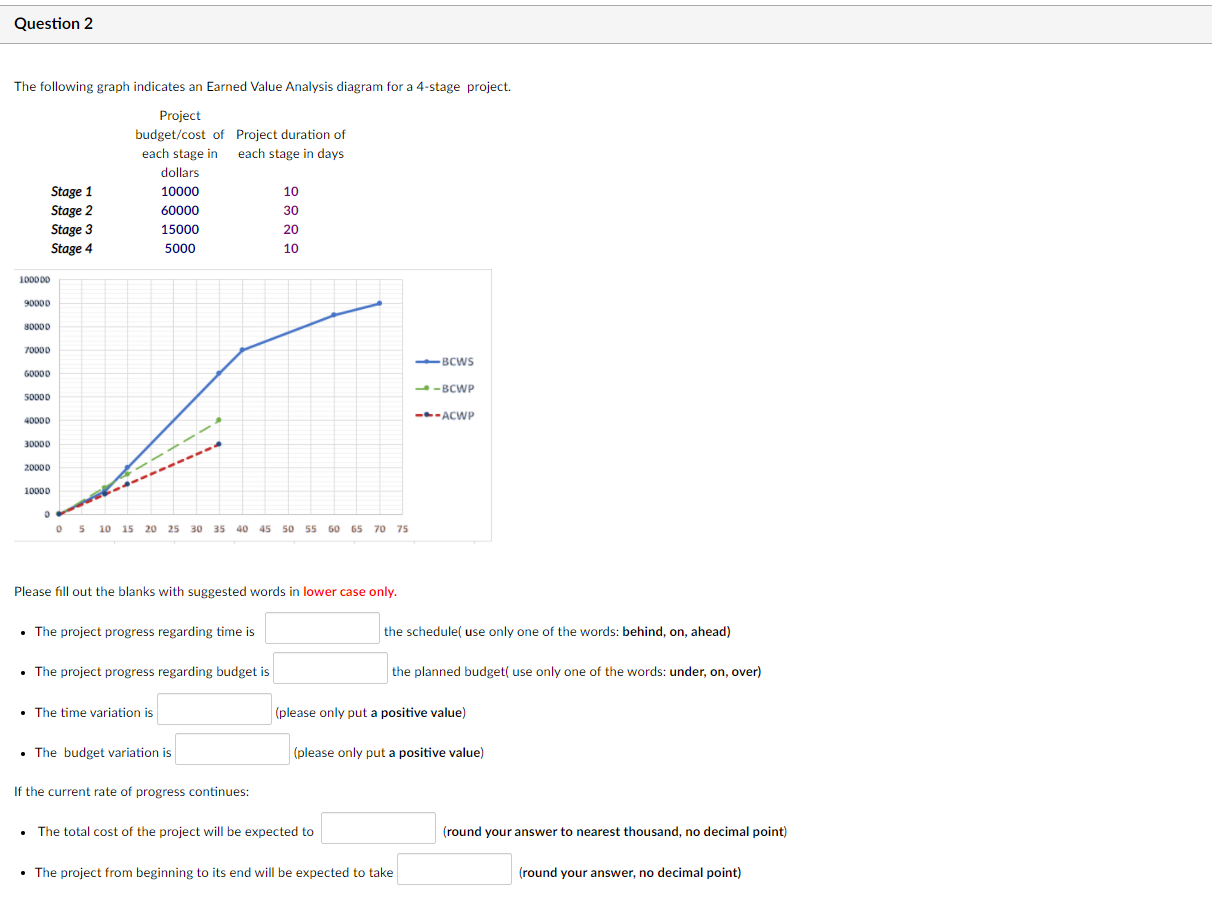
Question: Help asap Question 2 The following graph indicates an Earned Value Analysis diagram for a 4-stage project. Project budget/cost of Project duration of each stage

Help asap Question 2 The following graphHelp asap Question 2 The following graphHelp asap

Question 2 The following graph indicates an Earned Value Analysis diagram for a 4-stage project. Project budget/cost of Project duration of each stage in each stage in days dollars 10000 10 60000 30 15000 20 5000 10 Stage 1 Stage 2 Stage 3 Stage 4 100000 9000D 80000 7000D BCWS 60000 .-BCWP SODDD 4000D --ACWP 30000 2000D 10000 0 5 10 15 20 25 30 35 40 45 50 55 60 65 70 75 Please fill out the blanks with suggested words in lower case only. The project progress regarding time is the schedulel use only one of the words: behind, on, ahead) The project progress regarding budget is the planned budget( use only one of the words: under, on, over) The time variation is (please only put a positive value) The budget variation is (please only put a positive value) If the current rate of progress continues: . The total cost of the project will be expected to (round your answer to nearest thousand, no decimal point) The project from beginning to its end will be expected to take (round your answer, no decimal point) Question 1 A project consists of the following list of activities. Times are given in weeks. Activity Preceding Duration A 9 B A 10 12 D A 15 E B.C 13 F B 18 E, F 5 H D 6 H 8 J GI 6 K j 2 The critical path of this project is (please use upper case letter without any dash or space) The earliest time that this project could be completed is weeks. The slack time for: D=

Step by Step Solution

There are 3 Steps involved in it

1 Expert Approved Answer
Step: 1 Unlock blur-text-image
Question Has Been Solved by an Expert!

Get step-by-step solutions from verified subject matter experts

Step: 2 Unlock
Step: 3 Unlock

Students Have Also Explored These Related General Management Questions!