

Question: The following graph indicates an Earned Value Analysis diagram for a 4-stage project. Project budget/cost of each stage in dollars Project duration of each stage
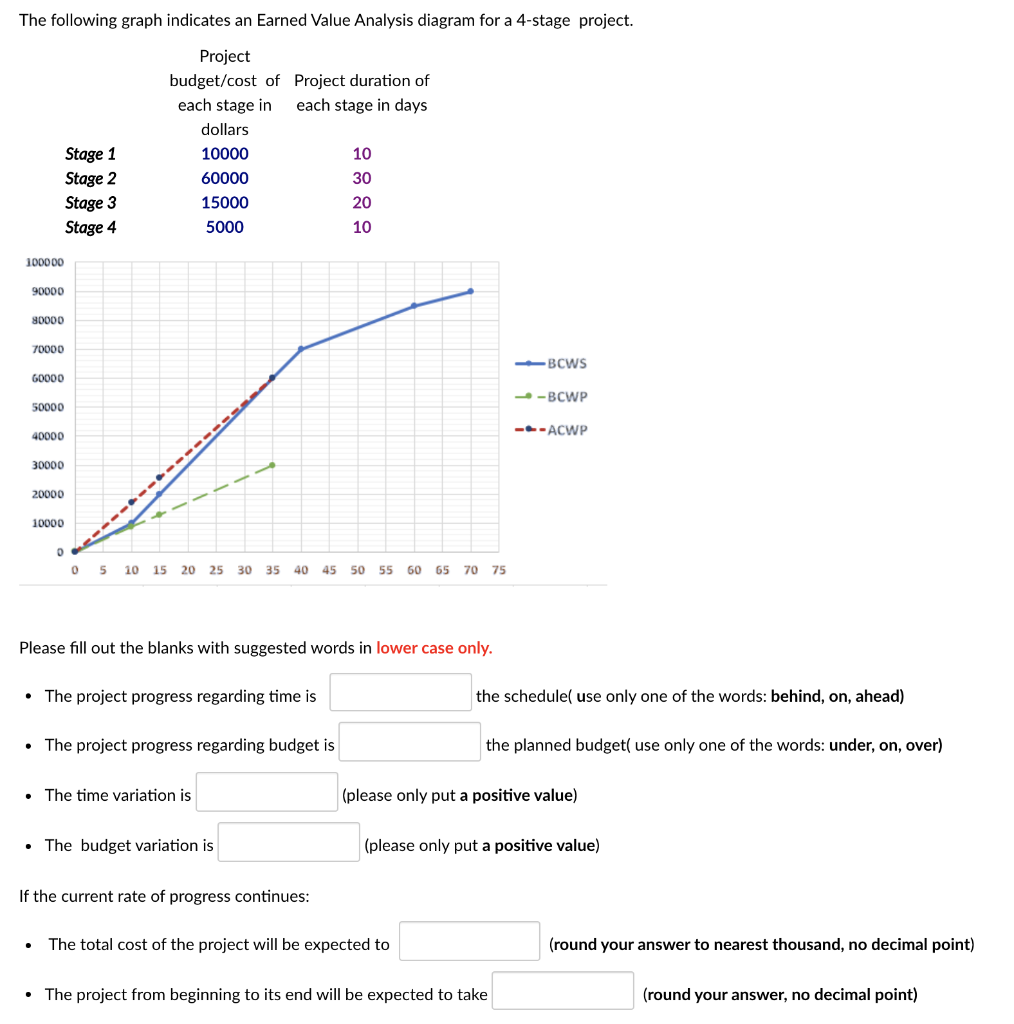
The following graph indicates an Earned Value Analysis diagram for a 4-stage project.
| Project budget/cost of each stage in dollars | Project duration of each stage in days | |
| Stage 1 | 10000 | 10 |
| Stage 2 | 60000 | 30 |
| Stage 3 | 15000 | 20 |
| Stage 4 | 5000 | 10 |
Please fill out the blanks with suggested words in lower case only.
- The project progress regarding time is the schedule( use only one of the words: behind, on, ahead)
- The project progress regarding budget is the planned budget( use only one of the words: under, on, over)
- The time variation is (please only put a positive value)
- The budget variation is (please only put a positive value)
If the current rate of progress continues:
- The total cost of the project will be expected to (round your answer to nearest thousand, no decimal point)
- The project from beginning to its end will be expected to take (round your answer, no decimal point)
Step by Step Solution
There are 3 Steps involved in it
1 Expert Approved Answer
Step: 1 Unlock

Question Has Been Solved by an Expert!
Get step-by-step solutions from verified subject matter experts
Step: 2 Unlock
Step: 3 Unlock