

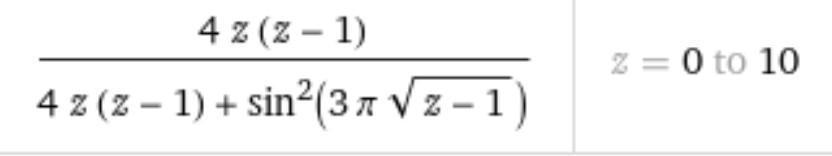
Question: Help edit the codes below to plot the given equation in Python. Thanks. import matplotlib.pyplot as plt import numpy as np import math #Constants z=np.linspace(0,10,
Help edit the codes below to plot the given equation in Python. Thanks.
import matplotlib.pyplot as plt import numpy as np import math
#Constants z=np.linspace(0,10, 100)
func1=4*z**2-4*z
func12= math.sin(3*math.pi*(z-1)**(1/2))
func13 = math.pow(func12,2)
func2=np.array(list(map(func13)))
y= func1/(func1+func2)
fig = plt.figure(figsize = (15, 10)) # Create the plot plt.plot(z, y alpha = 0.4, label ='Y', color ='red', linestyle ='dashed', linewidth = 2, marker ='.', markersize = 5, markerfacecolor ='green', markeredgecolor ='blue')
# Add X and y Label plt.xlabel('z axis') plt.ylabel('y axis')
# Add a grid plt.grid(alpha =.6, linestyle ='--')
# Add a Legend plt.legend()
# Show the plot plt.show()
4 2 (2-1) 4 z(- 1) + sin(37 V 2-1) z = 0 to 10
Step by Step Solution
There are 3 Steps involved in it

Get step-by-step solutions from verified subject matter experts