

Question: Help me please with steps so I can understand .. Twelve samples, each containing five parts, were taken from a process that produces steel rods
Help me please with steps so I can understand ..
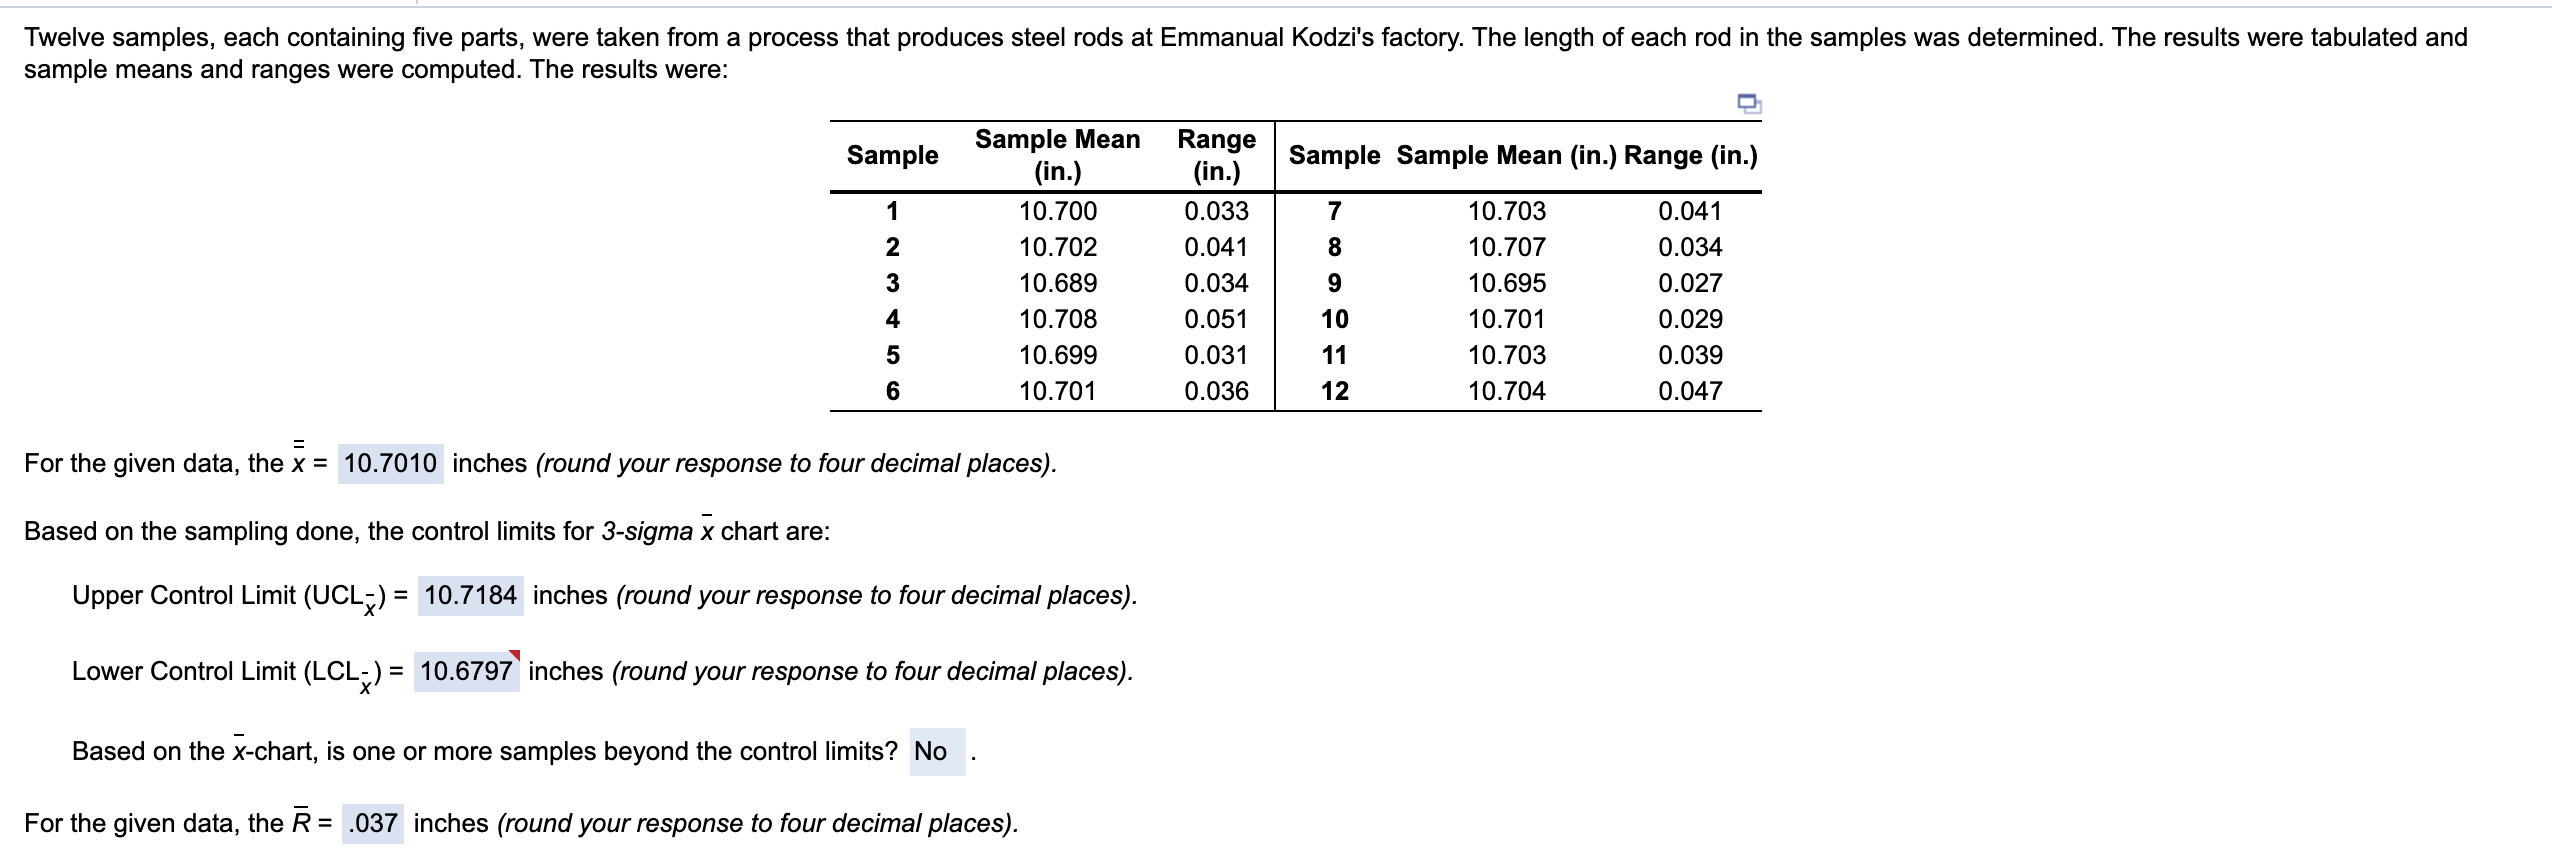
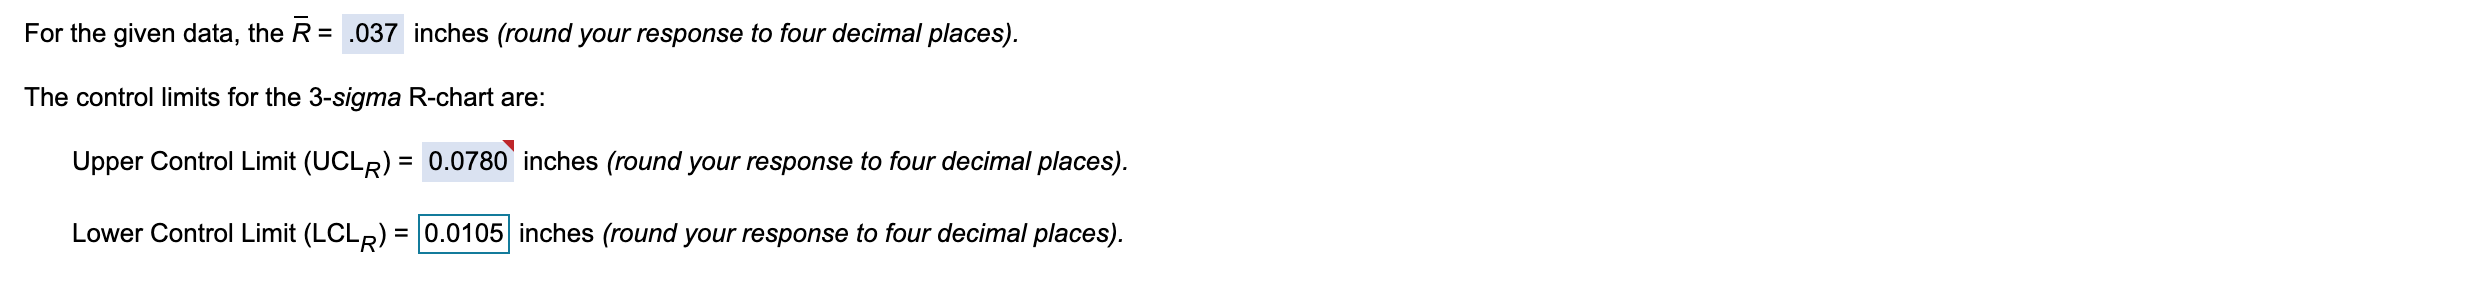
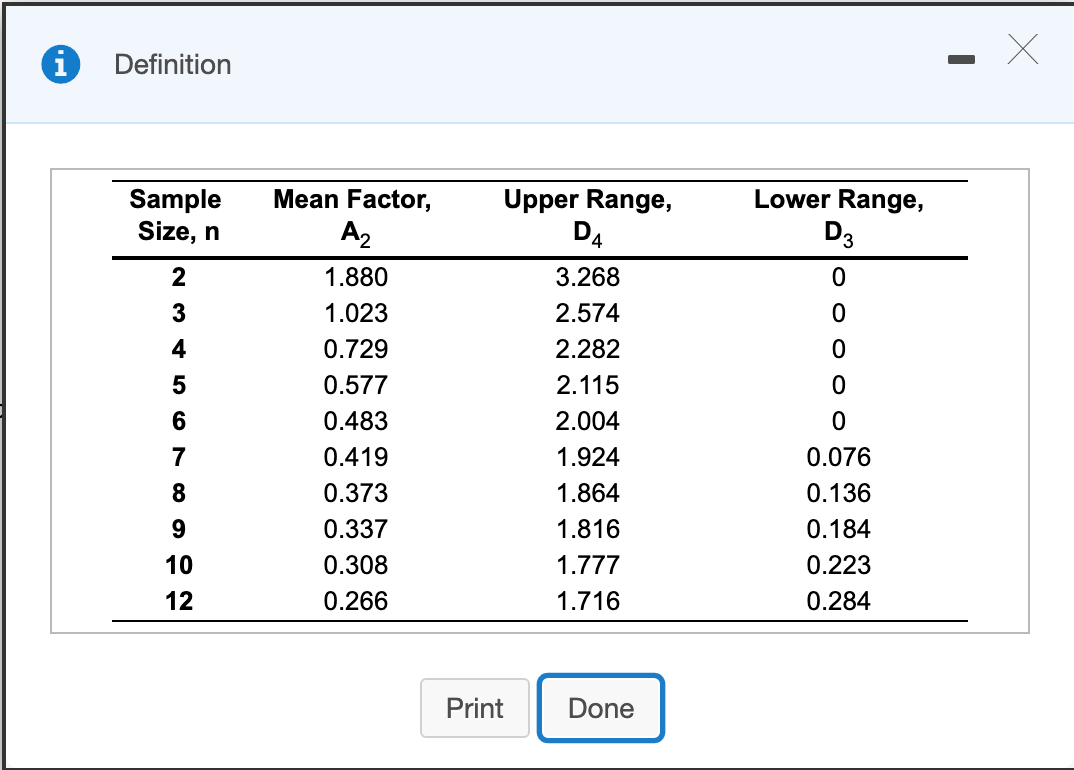
Twelve samples, each containing five parts, were taken from a process that produces steel rods at Emmanual Kodzi's factory. The length of each rod in the samples was determined. The results were tabulated and sample means and ranges were computed. The results were: Sample Sample Sample Mean (in.) Range (in.) WN - Sample Mean (in.) 10.700 10.702 10.689 10.708 10.699 10.701 Range (in.) 0.033 0.041 0.034 0.051 0.031 0.036 10.703 10.707 10.695 10.701 10.703 10.704 0.041 0.034 0.027 0.029 0.039 0.047 10 11 For the given data, the x = 10.7010 inches (round your response to four decimal places). Based on the sampling done, the control limits for 3-sigma x chart are: Upper Control Limit (UCL;) = 10.7184 inches (round your response to four decimal places). Lower Control Limit (LCL-) = 10.6797 inches (round your response to four decimal places). Based on the x-chart, is one or more samples beyond the control limits? No . For the given data, the R = .037 inches (round your response to four decimal places). For the given data, the R = .037 inches (round your response to four decimal places). The control limits for the 3-sigma R-chart are: Upper Control Limit (UCLR) = 0.0780 inches (round your response to four decimal places). Lower Control Limit (LCLR) = 0.0105 inches (round your response to four decimal places). Definition Upper Range, Sample Size, n DA Lower Range, D3 Mean Factor, Az 1.880 1.023 0.729 0.577 0.483 0.419 0.373 0.337 0.308 0.266 oo 3.268 2.574 2.282 2.115 2.004 1.924 1.864 1.816 1.777 1.716 0.076 0.136 0.184 0.223 0.284 Print DoneStep by Step Solution
There are 3 Steps involved in it
1 Expert Approved Answer
Step: 1 Unlock

Question Has Been Solved by an Expert!
Get step-by-step solutions from verified subject matter experts
Step: 2 Unlock
Step: 3 Unlock