

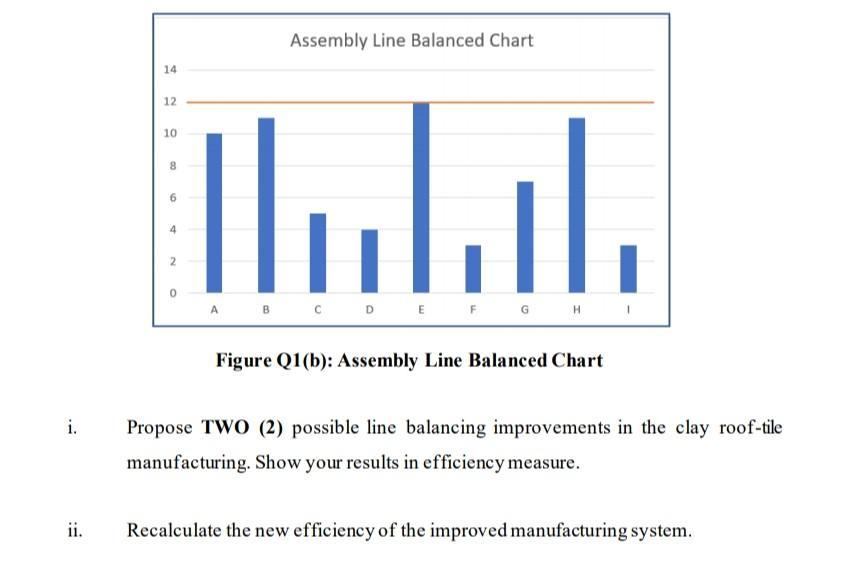
Question: Help me solving this question please. Tq (b) Analyse the Assembly Line Balancing (ALB) graph in Figure Q1(b). 1 Assembly Line Balanced Chart 14 12
Help me solving this question please. Tq
(b) Analyse the Assembly Line Balancing (ALB) graph in Figure Q1(b). 1 Assembly Line Balanced Chart 14 12 10 8 6 ILLUT. 4 2 0 A B C D E F G H Figure Q1(b): Assembly Line Balanced Chart i. Propose TWO (2) possible line balancing improvements in the clay roof tile manufacturing. Show your results in efficiency measure. Recalculate the new efficiency of the improved manufacturing system. (b) Analyse the Assembly Line Balancing (ALB) graph in Figure Q1(b). 1 Assembly Line Balanced Chart 14 12 10 8 6 ILLUT. 4 2 0 A B C D E F G H Figure Q1(b): Assembly Line Balanced Chart i. Propose TWO (2) possible line balancing improvements in the clay roof tile manufacturing. Show your results in efficiency measure. Recalculate the new efficiency of the improved manufacturing systemStep by Step Solution
There are 3 Steps involved in it
1 Expert Approved Answer
Step: 1 Unlock

Question Has Been Solved by an Expert!
Get step-by-step solutions from verified subject matter experts
Step: 2 Unlock
Step: 3 Unlock