

Question: Help plotting signals in Matlab. Hand sketches for 1.4. Use MATLAB to plot the functions (a) - (h) for -1 lessthanorequalto t lessthanorequalto 5 sec.
Help plotting signals in Matlab. Hand sketches for 1.4. 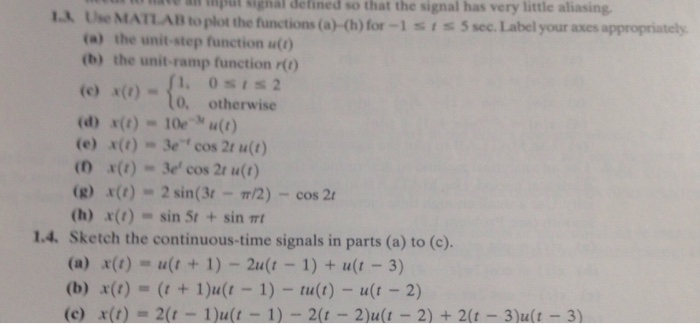
Use MATLAB to plot the functions (a) - (h) for -1 lessthanorequalto t lessthanorequalto 5 sec. Label your axes appropriately (a) the unit-steps functions u(t) (b) the unit-ramp function r(t) (c) x(t) = {1, 0 lessthanorequalto t lessthanorequalto 2 0, otherwise (d) x(t) = 10 e^-3t u(t) (e) x(t) = 3e^-t cos 2t u (t) (f) x(t) = 3e^-t cos 2t u (t) (f) x(t) = 3e^t cos 2t u (t) (g) x(t) = 2 sin (3t - pi/2) - cos 2t (h) x(t) = sin 5t + sin pi t
Step by Step Solution
There are 3 Steps involved in it
1 Expert Approved Answer
Step: 1 Unlock

Question Has Been Solved by an Expert!
Get step-by-step solutions from verified subject matter experts
Step: 2 Unlock
Step: 3 Unlock