

Question: Help Question 1: (5 pts) What patterns are visible in this dataset (Note that years are typically not considered to Chapters 3 & 4 Homework
Help
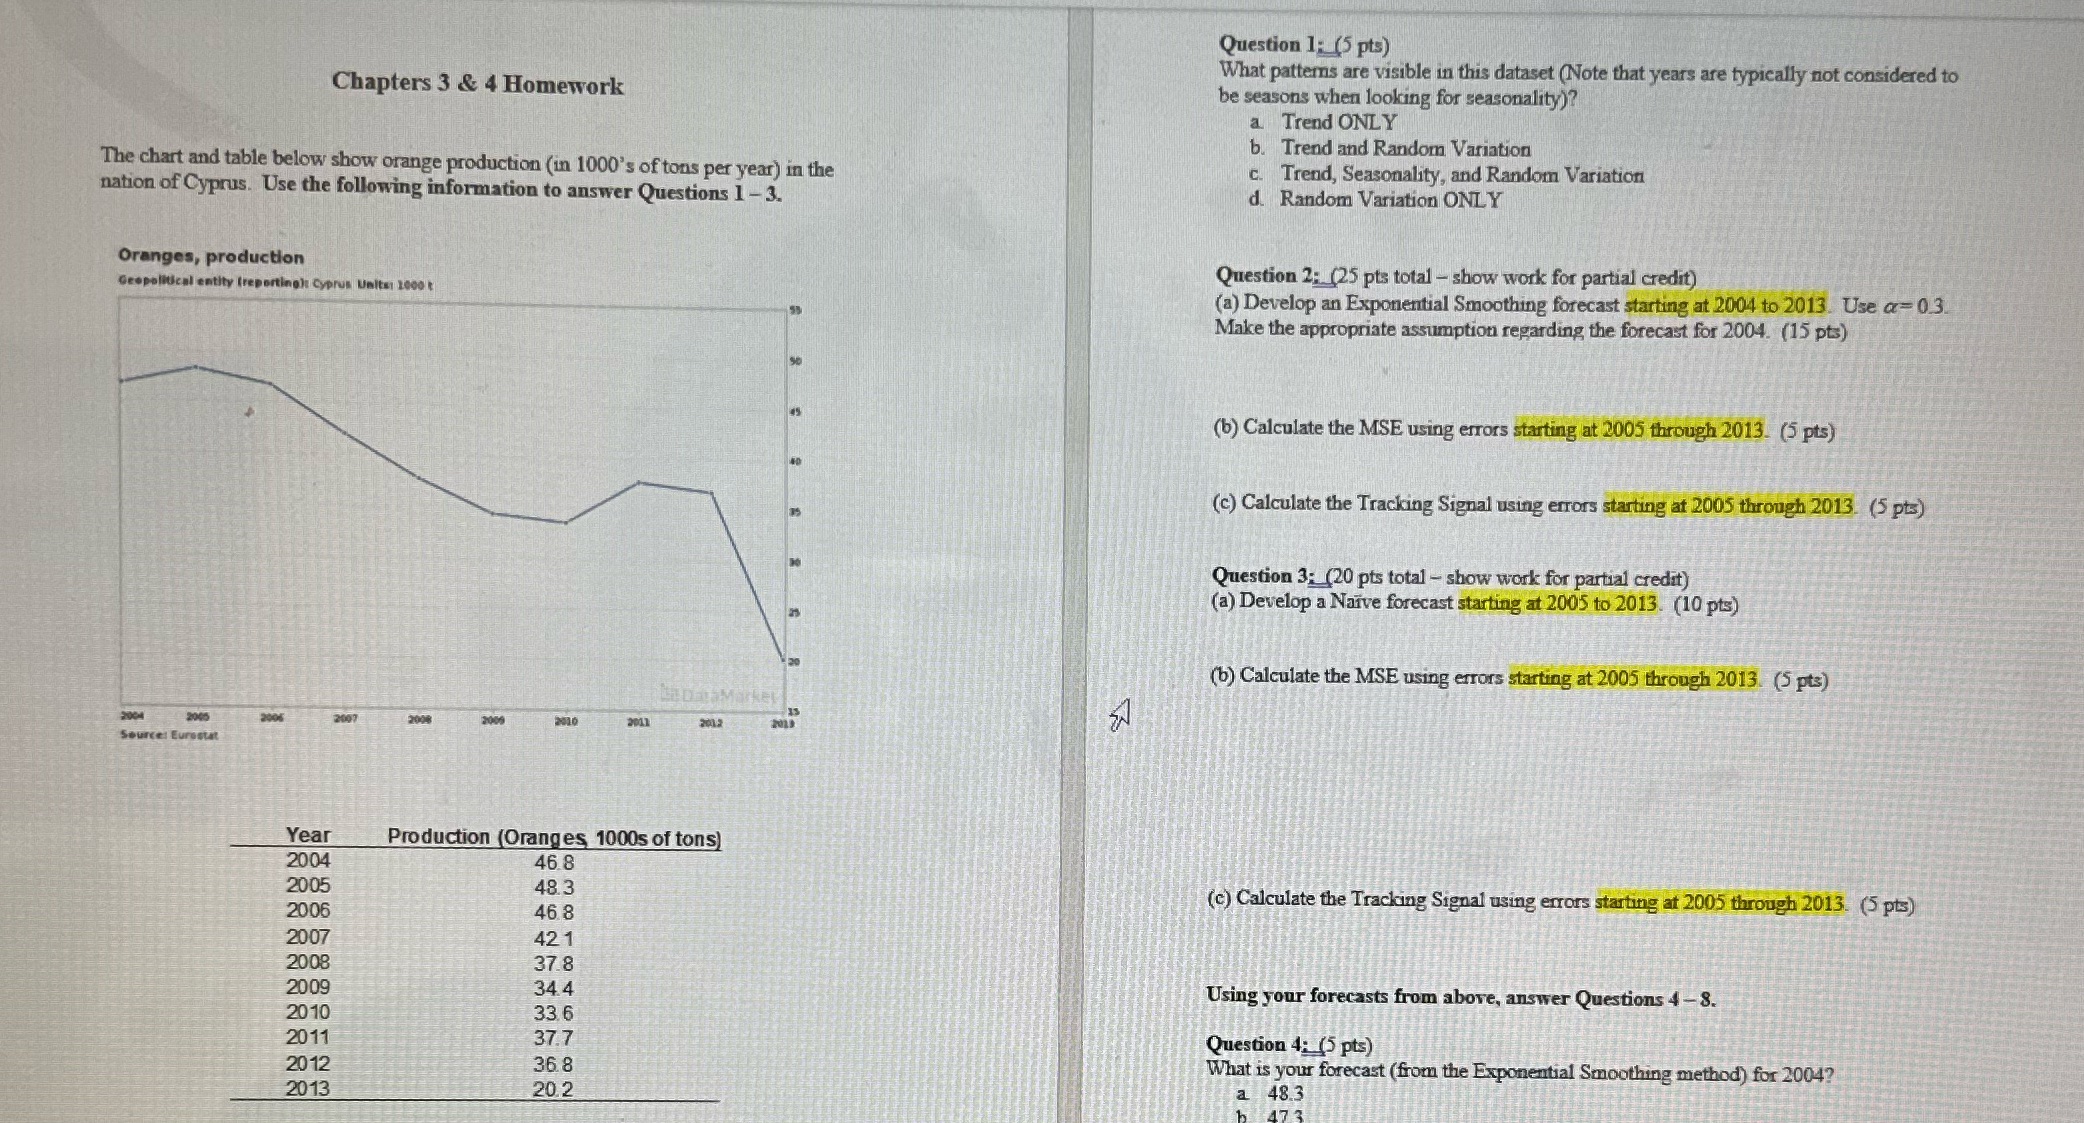
Question 1: (5 pts) What patterns are visible in this dataset (Note that years are typically not considered to Chapters 3 & 4 Homework be seasons when looking for seasonality)? a Trend ONLY b. Trend and Random Variation The chart and table below show orange production (in 1000's of tons per year) in the c. Trend, Seasonality, and Random Variation nation of Cyprus. Use the following information to answer Questions 1 -3. d. Random Variation ONLY Oranges, production Question 2: (25 pts total - show work for partial credit) Geopolitical entity (reportingit Cyprus Units, 1060 (a) Develop an Exponential Smoothing forecast starting at 2004 to 2013. Use a = 0.3. Make the appropriate assumption regarding the forecast for 2004. (15 pts) (b) Calculate the MSE using errors starting at 2005 through 2013. (5 pts) (c) Calculate the Tracking Signal using errors starting at 2005 through 2013. (5 pts) Question 3: (20 pts total - show work for partial credit) (a) Develop a Naive forecast starting at 2005 to 2013. (10 pts) (b) Calculate the MSE using errors starting at 2005 through 2013. (5 pts) 2004 2046 2009 2010 2041 2012 Source: Eurostat Year Production (Oranges 1000s of tons) 2004 46.8 2005 48.3 (c) Calculate the Tracking Signal using errors starting at 2005 through 2013. (5 pts) 2006 46 8 2007 421 2008 37 8 2009 34.4 Using your forecasts from above, answer Questions 4 - 8. 2010 33.6 2011 37.7 Question 4: (5 pts) 2012 36. 8 What is your forecast (from the Exponential Smoothing method) for 2004? 2013 20.2 48.3
Step by Step Solution
There are 3 Steps involved in it

Get step-by-step solutions from verified subject matter experts