

Question: Help with interpretation Construct scatter plots of Demand vs. DIFF and Demand vs. ADV, Demand vs. AIP, and Demand vs. Price. Insert fitted lime, equation,
Help with interpretation 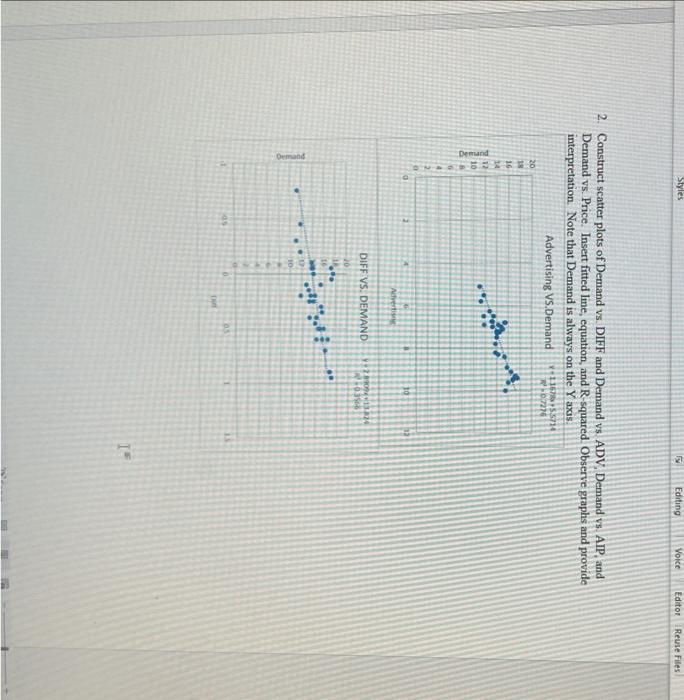
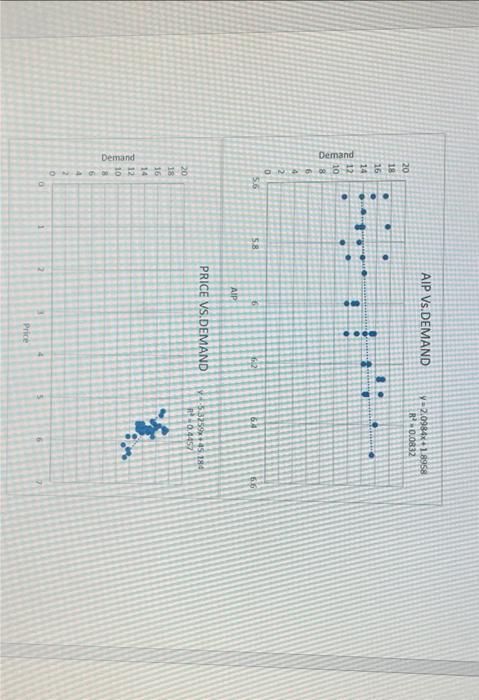
Construct scatter plots of Demand vs. DIFF and Demand vs. ADV, Demand vs. AIP, and Demand vs. Price. Insert fitted lime, equation, and R-squared. Observe graphs and provide interpretation. Note that Demand is always on the Y axis
Step by Step Solution
There are 3 Steps involved in it
1 Expert Approved Answer
Step: 1 Unlock

Question Has Been Solved by an Expert!
Get step-by-step solutions from verified subject matter experts
Step: 2 Unlock
Step: 3 Unlock