

Question: Construct scatter plots of Demand vs. DIFF and Demand vs. ADV , Demand vs. AIP , and Demand vs. Price . Insert fitted line, equation,
Construct scatter plots of Demand vs. DIFF and Demand vs. ADV, Demand vs. AIP, and Demand vs. Price. Insert fitted line, equation, and R-squared. Observe graphs and provide interpretation for all 4 Graphs. Note that Demand is always on the Y-axis
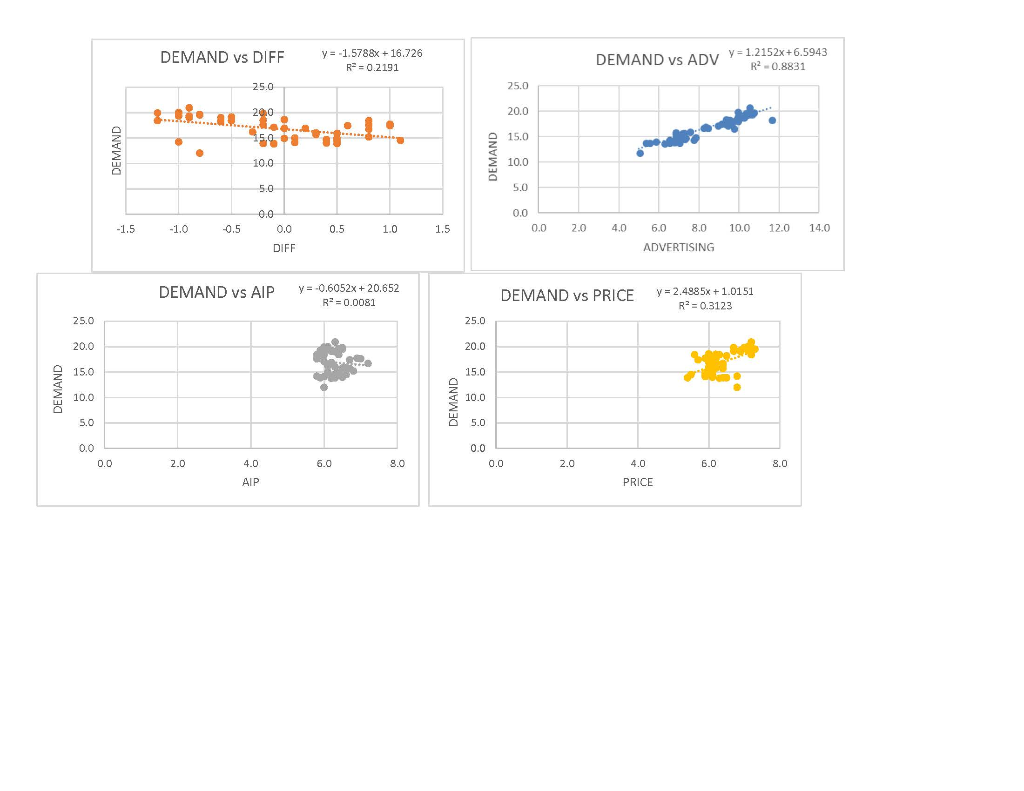
DEMAND vs DIFF y = -1.5788x + 16.726 R = 0.2191 DEMAND vs ADV Y = 1.2152x+6.5943 R2 -0.8831 25.0 25.0 2010 20.0 . . 15.00 15.0 DEMAND DEMAND 10.0 10.0 5.0 5.0 0.0 0.0 0.0 0.0 -1.5 -1.0 -0.5 0.5 1.0 1.5 2.0 4.0 6.0 8.0 10.0 12.0 14.0 DIFF ADVERTISING DEMAND vs AIP y = -0.6052x + 20.652 RP=0.0081 DEMAND vs PRICE y = 2.4985x +1.0151 RP = 0.3123 25.0 25.0 20.0 20.0 15.0 15.0 DEMAND 10.0 DEMAND 10.0 5.0 5.0 0.0 0.0 0.0 2.0 4.0 5.0 8.0 0.0 2.0 4.0 6.0 8.0 AIP PRICE
Step by Step Solution
There are 3 Steps involved in it
1 Expert Approved Answer
Step: 1 Unlock

Question Has Been Solved by an Expert!
Get step-by-step solutions from verified subject matter experts
Step: 2 Unlock
Step: 3 Unlock