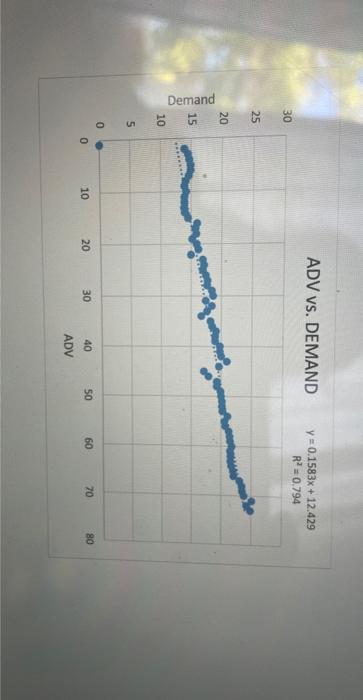
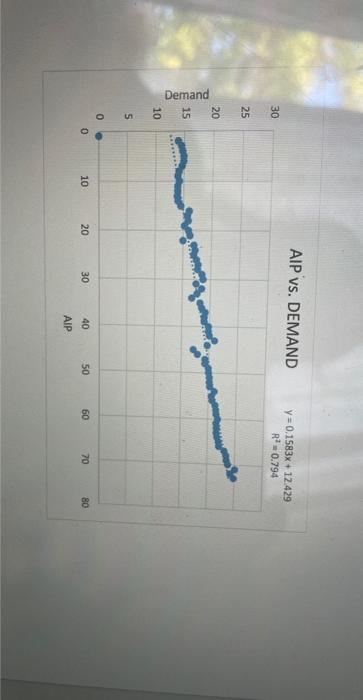
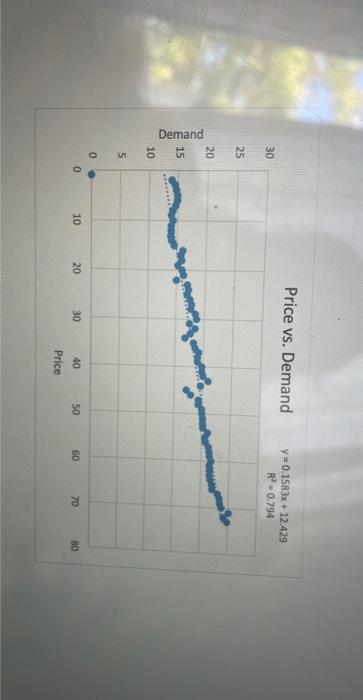
Question: I need the interpretation for each graphs 3. Construct scatter plots of Demand vs. DIFF and Demand vs. ADV, Demand vs. AIP, and Demand vs.

I need the interpretation for each graphs I need the interpretation for each graphs 3.
I need the interpretation for each graphs 3.
3. Construct scatter plots of Demand vs. DIFF and Demand vs. ADV, Demand vs. AIP, and Demand vs. Price. Insert fitted line, equation, and R-squared. Observe graphs and provide interpretation. Note that Demand is always on the Y axis. ADV VS. DEMAND y=0.1583x+12.429 Price vs. Demand y=0.1583x+12.429

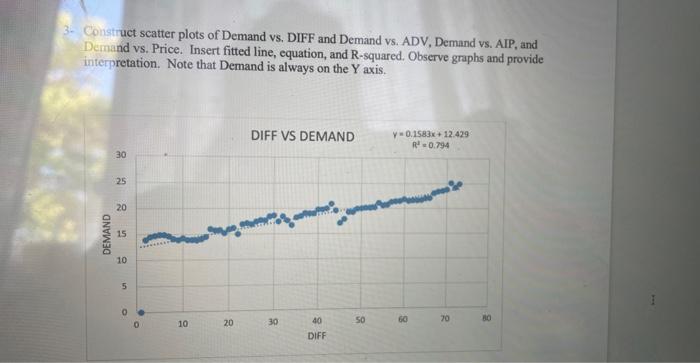
Step by Step Solution

There are 3 Steps involved in it

1 Expert Approved Answer
Step: 1 Unlock blur-text-image
Question Has Been Solved by an Expert!

Get step-by-step solutions from verified subject matter experts

Step: 2 Unlock
Step: 3 Unlock

Students Have Also Explored These Related General Management Questions!